We outlined the potential performance benefits of
FastReplica in the small in Section 3.3. The goal of
this section is to analyze the FastReplica performance in the
real Internet environment. Through experiments on a prototype
implementation, we will demonstrate the efficiency of FastReplica
in the small in a wide-area testbed. Since FastReplica in the
small defines the iteration step in the general algorithm, these
results will set the basis for performance expectations of
FastReplica in the large.
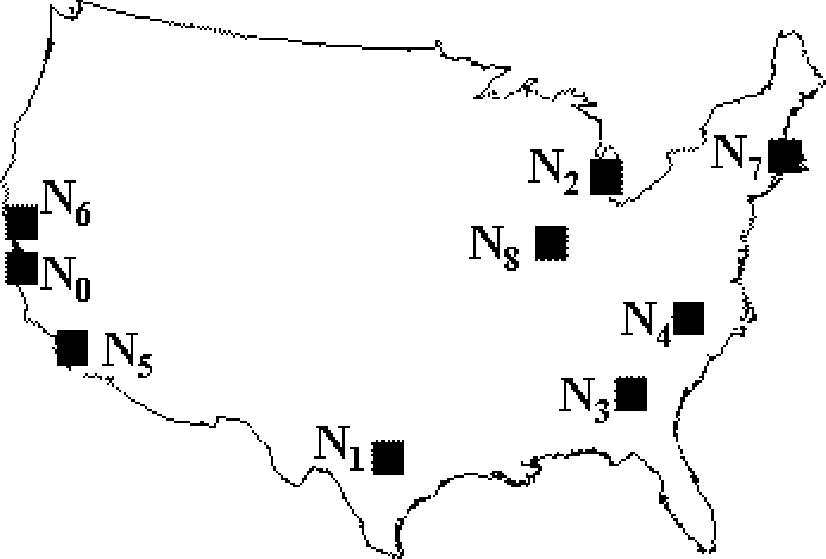
Using the generous help of summer interns at HPLabs, we built an
experimental testbed with 9 nodes. Table 1 and
Figure 10 show the 9 hosts participating in our
experiments and their geographic locations.
Table 1:
Participating nodes.
hp.com
Palo Alto, CA
utexas.edu
Austin, TX
umich.edu
Ann Arbor, MI
gatech.edu
Atlanta, GA
duke.edu
Durham, NC
uci.edu
Irvine, CA
berkeley.edu
Berkeley, CA
mit.edu
Cambridge, MA
uiuc.edu
Urbana-Champaign, IL
The source node is and is located at the HP site,
while the nodes-receivers are at different university sites. In order
to perform the sensitivity analysis, we vary the number of
participating hosts: in experiments with participating hosts
in replication set, the receivers are
ordered as shown
in Table 1.
Figure 10:
Geographic locations of hosts.
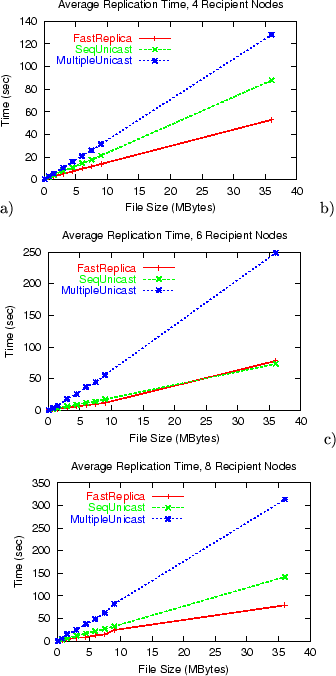
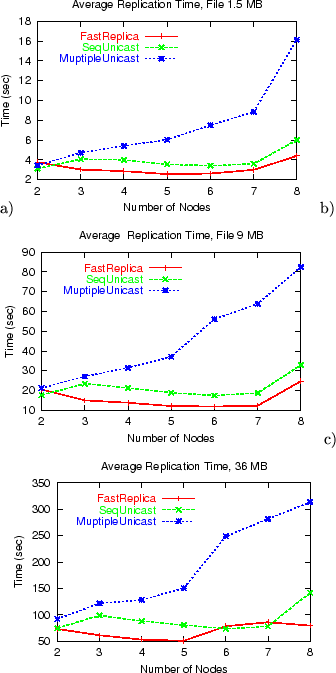
Figure 11:
Average replication time for files of different size and a different number of nodes in replication set a) 4 receivers, b) 6 receivers, c) 8 receivers.
Using the experimental testbed, we compare the following distribution
schemes:
FastReplica in the small: we used the FastReplica
algorithm designed for small, limited number of nodes and introduced
in Section 3.2.
Sequential Unicast: this scheme approximates
the ``best possible overlay tree'' for the entire set of group
members. For the evaluation, we use the Sequential
Unicast test which measures the file transfer time from the source to
each recipient independently (i.e. in the absence of other
recipients). Note that Sequential Unicast is not a
feasible overlay, but a hypothetical construction used for comparison
purposes. The measurements under Sequential Unicast approximate
the file distribution using IP multicast.
Multiple Unicast: under this scheme, the original node
simultaneously transfers the entire file to all the recipient nodes by
using the concurrent connections. Assuming an infinite bandwidth at
the original node, this scheme can be considered as a feasible
solution for the above ``best possible overlay tree''.
The experiments are conducted at an application level. Ideally, the
transfer time at each recipient node should be measured from the
beginning of the transfer at the source node to the completion of the
file download at the recipient node. However, due to clock
synchronization problems at different nodes, we measure the file
transfer time at each recipient node from the beginning of file
download to the end of file download at the corresponding recipient
node. Since we are interested in large file transfers, the omission
of one-way latency of the first packet from the source to the
recipient cannot impact the accuracy of the results.
In our study, we consider the two performance metrics introduced in
Section 3.3: average replication time and
maximum replication time.
To analyze the efficiency of FastReplica, we performed its
sensitivity analysis for replication of different size files and
across different numbers of nodes in the replication set. We
experimented with 9 file sizes: 80 Kbytes, 750 Kbytes, 1.5 MBytes,
3 MBytes, 4.5 MBytes, 6 MBytes, 7.5 MBytes, 9 MBytes, and 36 MBytes,
and varied the number of nodes in the replication set from 2 to 8. When running
experiments with different parameters and strategies, the experiments
for the same file size were clustered in time as closely as possible
to eliminate biases due to short time scale changes in network and
system conditions. In order to eliminate the biases due to longer
time scale changes in network and system conditions, we performed the
same set of experiments at different times of the day. Each point in
the results is averaged over 10 different runs which were performed
over a 10 day period.
Figure 11 shows the average file replication time for
experiments with 4, 6, and 8 recipient nodes in the replication set and
files of different sizes. For file sizes larger than 80 Kbytes,
FastReplica significantly outperforms Multiple Unicast. The
replication time under FastReplica is 2-4 times better
than under Multiple Unicast.
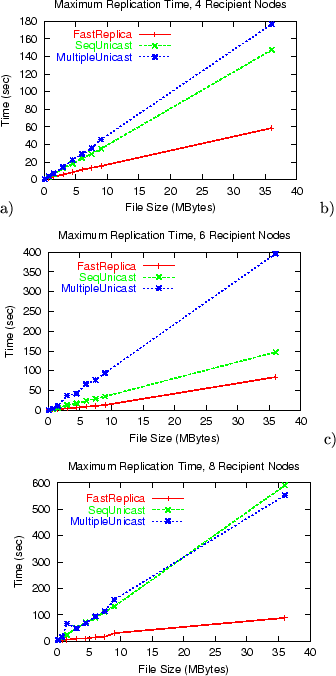
Figure 12:
Maximum replication time for files of different size and a different number of nodes in replication set a) 4 receivers, b) 6 receivers, c) 8 receivers.
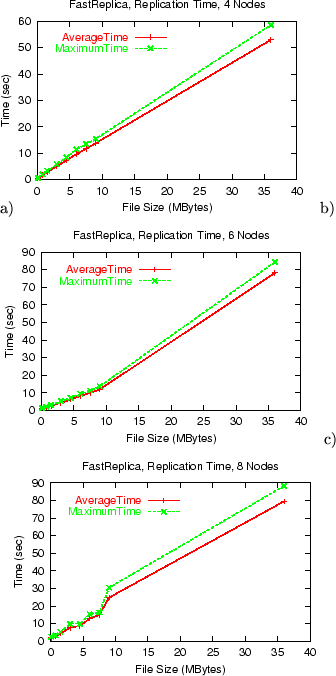
Figure 13:FastReplica: average vs maximum replication
time for a different number of nodes in replication set a) 4 receivers,
b) 6 receivers, c) 8 receivers.
Additionally, in most experiments, FastReplica outperforms
Sequential Unicast, which approximates the file replication with IP
multicast. The explanation is that when Sequential Unicast
replicates file to nodes, it uses Internet paths
connecting the source nodes to the recipient nodes (while sending only
one packet over each common link in those paths). Thus the overall
performance is defined by the end-to-end properties of the
paths. Congestion in any of those paths impacts the overall
performance of the Sequential Unicast. FastReplica uses
the same paths between the source and recipient nodes to
transfer only -th of file . FastReplica takes
advantage of using the additional
paths between the
nodes in the replication set, and each of those paths is used for
sending -th of file . Thus, the congestion in any of
those paths impacts FastReplica performance for transfer of only
the -th of file .
While the average replication time provides an interesting metric for
distribution strategy characterization, the metric representing the
maximum replication time is critical, because it reflects the worst
case of the replication time among the recipient nodes.
Figure 12 shows the maximum replication time for
experiments with 4, 6, and 8 recipient nodes in a replication set and
files of different sizes. The maximum replication times under
Multiple Unicast, as well as Sequential Unicast, are much
higher than the corresponding average times for these strategies. For
a case of 8 nodes in the replication set, the maximum times under
Multiple Unicast and Sequential Unicast are almost 2 times
higher than the corresponding average times. The reason is that there
is a very limited bandwidth on the path from the source node to
the recipient node . The performance of this path is practically the
same for both Multiple Unicast and Sequential
Unicast. This path defines the worst (maximum) replication time among
all the recipient nodes in the set. Since FastReplica uses this
path to transfer only -th of file , this ``bad'' path has
a very limited impact on maximum replication time and overall
performance of FastReplica.
Figure 13 shows how close the average and maximum
replication times under FastReplica are. These results
demonstrate the robustness and predictability of performance results
under the new strategy.
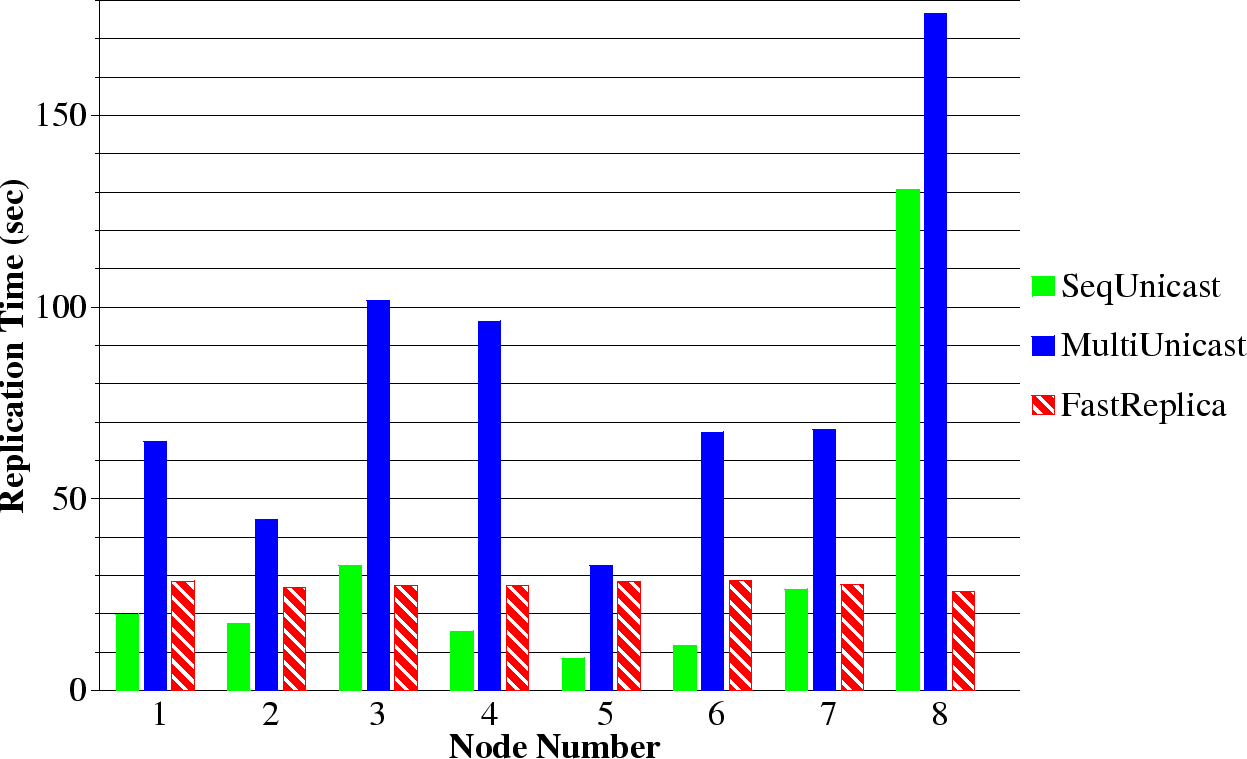
Figure 14:
Replication time measured by individual receiving nodes for 9 MB file and 8 nodes in replication set.
Figure 14 shows the average replication time measured by
the different, individual recipient nodes for a 9 MB file and 8 nodes in the
replication set (the other graphs for different file sizes and a
different number of nodes in the replication set reflect similar
trends). There is a high variability of replication time under
Multiple Unicast and Sequential Unicast. This is somewhat
expected because the file replication times at the individual nodes
highly depend on the available bandwidth of the path connecting the
source and receiver node. The limited bandwidth of the path between
the original node and the receiver node can be observed from these
measurements, and it severely impacts the overall performance of both
Multiple Unicast and Sequential Unicast. The file replication
times under FastReplica across different nodes in the replication
set are much more stable and predictable since each node performance is
defined by the bandwidth of paths, each transferring -th of the original file .
Figure 15:
Average file replication time for a different number of nodes
in replication set and a) File size of 1.5 MB, b) File size of 9 MB,
c) File size of 36 MB.
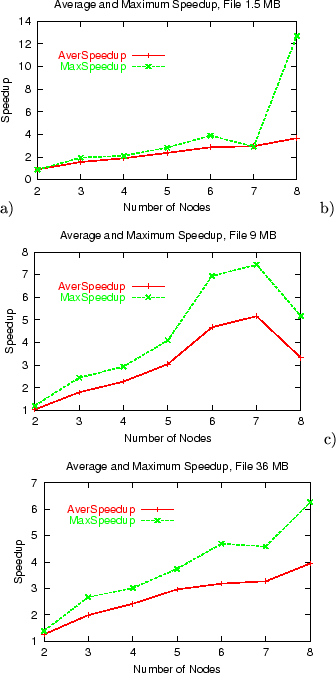
Figure 16:
Speedup in average and maximum file replication time
under FastReplica vs Multiple Unicast for a different number
of nodes in replication set and a) 1.5 MB file, b) 9 MB file, c) 36 MB
file.
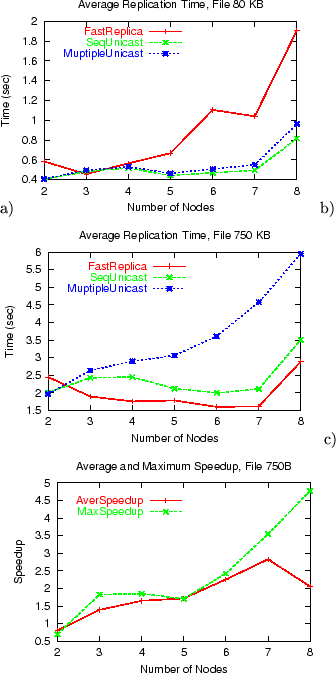
Figure 17:
Average file replication time for a different number of nodes
in replication set and a) File size of 80 KB, b) File size of 750 KB, c) Speedup in file replication time under FastReplica vs Multiple Unicast for 750 KB file.
Figure 15 shows the average replication time for
files of 1.5 MB, 9 MB, and 36 MB for a different number of nodes in the
replication set. While Multiple Unicast shows a growing
replication time for an increasing number of nodes in the replication
set, FastReplica and Sequential Unicast demonstrate good
scalability for replication sets of different
sizes. Additionally, FastReplica consistently outperforms
Sequential Unicast for most of the points.
Figure 16 shows the average and maximum speedup of
file replication time under proposed FastReplica in the small
relative to the replication time of Multiple Unicast for files
of 1.5 MB, 9 MB, and 36 MB, and a different number of nodes in the
replication set. The results consistently show the significant speedup
both in average and maximum replication times across considered
different file sizes.
Finally, Figures 17 a) and b) show the average replication
time for 80 KB and 750 KB files and a different number of nodes in the
replication set. The files of 80 KB and 750 KB are the smallest ones
used in our experiments. For the 80 KB file, FastReplica is not
efficient, and the replication time (both average and maximum) is
higher than under Sequential Unicast and Multiple Unicast.
For the 750 KB file, the replication time under FastReplica is
better than under Sequential Unicast and Multiple Unicast
strategies, and the average and maximum speedup shown in
Figure 17 c) is again significant. These results help to
outline the ``border'' parameters for new strategy usage: in our case
study, FastReplica works most efficiently for replicating files
larger than 0.5 MB. For , the ``border'' file size, where
FastReplica works most efficiently, may increase correspondingly.
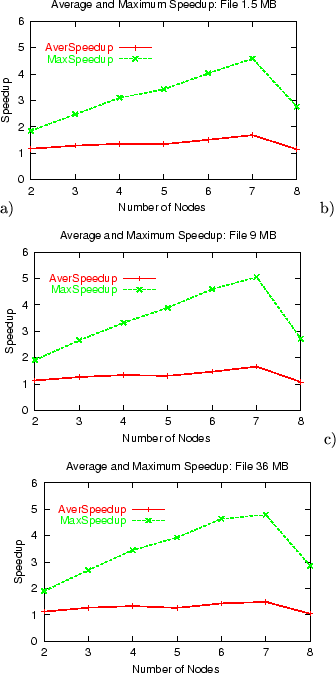
Figure 18:
Different configuration with (utexas.edu) being
the origin node: speedup in average and maximum
replication times under FastReplica vs Multiple Unicast for
a different number of nodes in replication set and a) 1.5 MB file, b)
9 MB file, c) 36 MB file.
The results presented in Figure 16 show the
significant speedup both in average and maximum replication times
under the FastReplica strategy. The additional analysis reveals
that the available bandwidth of the paths between the origin node
(hp.com) and nodes (universities'
machines) is significantly lower than the cross bandwidth between
nodes . only node has a limited incoming
bandwidth from all the nodes
, while the outgoing
bandwidth from node to is again significantly higher.
In such a configuration, FastReplica utilizes the abundance of
additional available bandwidth between the replication nodes in the
most efficient way to produce the spectacular results.
It is interesting to see how FastReplica would perform when a
different node with high bandwidth paths to the rest of the nodes is
used as the origin node. We changed the configuration and made
node (utexas.edu) to be the origin node, and rerun the
experiments again.
Figure 18 shows the average and
maximum speedup of file replication time under the proposed
FastReplica in the small relative to the replication time of
Multiple Unicast for files of 1.5 MB, 9 MB, and 36 MB, and a different
number of nodes in the replication set in the new configuration.
In the new configuration, the average replication times under
FastReplica and Multiple Unicast are similar, but the maximum
replication time under FastReplica is still significantly better
than the maximum replication time under Multiple Unicast.
The bandwidth analysis reveals that node utexas.edu is connected
to the rest of the nodes via high bandwidth paths with low bandwidth
variation across these paths. Our analysis in Section 3.3
with a specially designed example, where the bandwidth matrix is defined by
equations (6), demonstrates that when the cross
bandwidth between some replication nodes is significantly lower than
the bandwidth of the original paths from to the recipient nodes
then FastReplica improves the maximum
replication time but may have no significant improvement in average
replication time.
Next:5 Conclusion Up:FastReplica: Efficient Large File Previous:3.5 Reliable FastReplica Algorithm