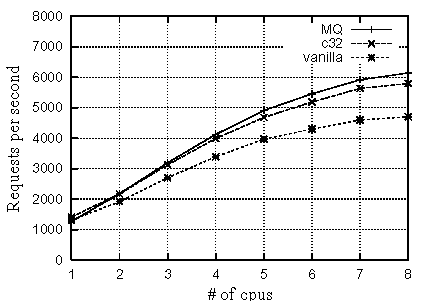
Figure 9 shows WebBench results for the following three kernel: standard kernel (vanilla), 32 coloring kernel (c32), and multi-queue scheduler kernel (MQ). Table 4 shows performance gains of c32 and MQ compared with vanilla.
We can see in this graph that both of c32 and MQ show better performance than vanilla. In Table 4, c32 and MQ achieves maximum of 23.3% and 30.6% improvement on an 8-way, respectively. In fact, MQ shows more performance improvement than c32. However, MQ requires more extensive changes to be implemented than c32. Although requiring less modification, c32 nearly achieves the performance improvement of MQ. Furthermore, c32 achieves speedup over all of the CPU set. In contrast, MQ's performance drops on single CPU system.
In Table 4, as the number of CPUs increases, c32 gains larger speeding up. When the number of CPUs is one, the performance gains is 8.2%. When the number of CPUs becomes 8, the performance gains 23.3%. The major reason is the improved lock statistics. The reduction of cache misses in scheduler makes the traversal time shorter and dramatically decreases the holding time for the run queue lock. Thus, our coloring method could perform more effectively on a SMP system rather than a uniprocessor system.
To confirm this, we also measured following two characteristics.
The results are shown in Table 5 and 6, respectively. In the case of vanilla kernel, the list_for_each() loop involves potentially large cache misses as seen in Table 5, resulting more than 90% cache miss ratio. In contrast, 32 coloring shows substantial reduction to about 10% on any number of CPUs system. Moreover, in Table 6, both of the mean of lock hold time and the lock contention are largely reduced on any number of CPUs system by using 32 coloring. The lock contention is reduced from 45.6% to 23.4% on an 8-way system. This leads to better scalability than vanilla kernel.
|
|
|