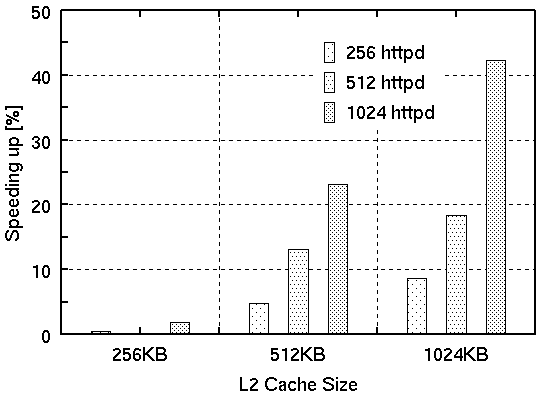
At first, we show the performance of the coloring scheme with three different cache configurations, in Figure 6. The horizontal axis is the cache size, and the vertical axis is the performance improvement ratio based on the vanilla kernel. In the experiment, the maximum number of httpd processes on a server is set to 256, 512 and 1024, and the number of colors was fixed to 32. We show performance data of the coloring scheme for three different cache configurations.
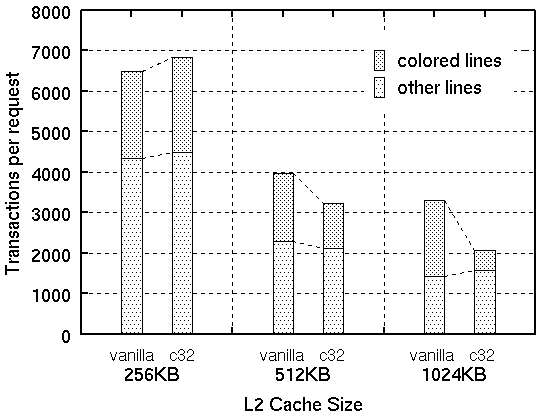
Second, to measure the coloring effect directly, the number of bus transactions on the memory bus was measured with 1024 httpd processes. In the Figure 7, bus transactions are sorted in the following two categories:
Finally, we measured the number of L2 cache misses and total L2 read
counts during the execution of list_for_each loop using the
performance monitoring counters built into the Pentium processor.
This loop traverses the global run queue.
Table 2 gives the average of L2
cache miss ratio with three cache sizes.
The miss ratio is calculated by the following equation:
| (2) |
At an L2 cache size of 256KB, we see little or no performance
improvement from colorizing (Fig 6). In fact, the number of memory bus
transactions per request increased slightly (Fig 7).
This is the negative
effect of coloring described in Section 3.3.
In the case of 32 colorings,
![]() processes ideally should be stored in a
cache memory.
As shown in Table 2, however, the ratio of L2 cache miss
in list_for_each loop, achieves only 17%-age points reduction.
This is because all of
task structures are not always contiguously allocated in main memory.
Therefore the theoretically possible
number of task structures was not stored in cache memory.
Since the effect of coloring is partially canceled by the negative effect of
increasing bus
transactions, there was less performance improvement in the case of
256KB L2 cache.
processes ideally should be stored in a
cache memory.
As shown in Table 2, however, the ratio of L2 cache miss
in list_for_each loop, achieves only 17%-age points reduction.
This is because all of
task structures are not always contiguously allocated in main memory.
Therefore the theoretically possible
number of task structures was not stored in cache memory.
Since the effect of coloring is partially canceled by the negative effect of
increasing bus
transactions, there was less performance improvement in the case of
256KB L2 cache.
On the other hand, in Figure 6, significant improvement is observed with both 512KB and 1024KB L2 cache size. The 32 coloring kernel achieves a maximum of 23.1% and 42.3% performance improvement compared to the vanilla one. Also the cache miss ratio is dramatically reduced. Without coloring, the cache miss rate was 99.5% for L2 accesses. Using 32 colors, the L2 cache miss rate decreased to 35.8% and 8.2% with 512KB and 1024KB L2 cache, respectively. As a result, the number of bus transactions for colored cache lines decreases by 33.3% and 73.0% compared to the vanilla kernel (Fig. 7).
As shown above, the cache coloring is more effective for a large cache size, because the large cache area can be utilized to reduce cache conflicts for the run queue.