 |

Monitoring progress An API call, GetProcessMemoryInfo, provides information about the resident memory of a process. Unlike the CPU case, the sampling of this information can be adapted to the rate at which the application consumes memory resources. To estimate the latter, we integrate the sampling with the controlling scheme described below.
Controlling progress As described in Section 3, controlling progress of memory resources requires the sandboxing code to relinquish surplus memory pages to the OS. To do this, we rely on a convention in NT: pages whose protection attributes are marked NoAccess are collected by the swapper.
The same core OS mechanism, user-level protection fault handlers, is used to decide both (a) when a page must be relinquished, and (b) which page this must be. Our scheme intercepts the memory allocation APIs (e.g., VirtualAlloc and HeapAlloc) to build up its own representation of the process working set. When the allocated pages exceed the desired working set size, the extra pages are marked NoAccess. When such a page is accessed, a protection fault is triggered: the sandbox catches this fault and changes page protection to ReadWrite. Note that this might enlarge the working set of the process, in which case a FIFO policy is used to evict a page from the (sandbox-maintained view of the) working set. The protection fault handler also provides a natural place for sampling the actual working set size, since a process's consumption of memory is reflected by the number of faults it incurs.
A few additional points need clarification. The implementation is simplified by not evicting pages containing executable code, so this limits the least amount of memory that can be constrained. Eviction at the sandbox level may or may not cause the page to be written to disk although these pages are excluded from the process working set; when the system has large amounts of free memory, NT maintains some pages in a transition state delaying writing them to disk. Note that with our design, if the application is running within its memory limits, it will not suffer from any runtime overhead (except that of intercepting API calls). Beyond that point, the overheads are a function of process virtual memory locality behavior.
Effectiveness of the sandbox
Our experiments show that, on a 450 MHz Pentium II machine with 128MB
memory, this sandbox implementation can effectively control actual
physical memory usage from 1.5MB up to around 100MB. The lower bound
marks the minimal memory consumption when the application is
loaded, including that by system DLLs.5 The upper bound approximates the maximum amount
of memory an application can normally use in our system. The memory overhead
includes 64KB for the code injected into application address space and
4 bytes for keeping track of each page in the working set. The overhead of
intercepting a memory allocation call is measured as 1.07us when the specified memory constraints
are above the working set size (thus no page fault is incurred).
When the constraints are below the required working set size, process
memory locality behavior determines the overhead. However, because of
our CPU accounting scheme, only this process's execution time is affected.
 |
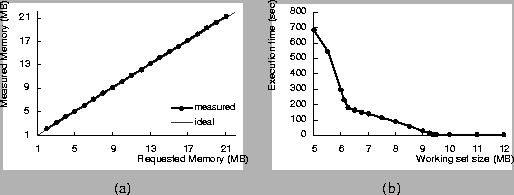
Figure 5(a) shows the
requested and measured physical memory allocations for an application that has
an initial working set size of 1.5MB and allocates an additional 20MB of memory.
The sandbox is configured to limit available memory to various sizes ranging
from 2MB to 21MB. As the figure shows, the measured memory allocation of the
application (read from the NT Performance Monitor) is virtually identical to
what was requested.
Figure 5(b) demonstrates the impact of the memory sandbox on application execution time. The application under study has a memory access pattern that produces page faults linearly proportional to the non-resident portion of its data set. In this case, the application starts off with a working set size of 1.5MB and allocates an additional 8MB. The sandbox enforces physical memory constraints between 5MB and 12MB. As the figure shows, the execution time behavior of the application can be divided into three regions with different slopes. When the memory constraint is more than 9.5MB, all of the accessed data can be loaded into physical memory and there are no page faults. When the memory constraint is below 9.5MB, total execution time increases linearly as the non-resident size increases, until the constraints reaches 6.25MB. In this region, page faults occur as expected but the process pages are not written to disk. When available memory is below 6.25MB, we observe heavy disk activity. In this segment, the execution time also varies approximately linearly, with the slope determined by disk access characteristics. These experiments show that our sandboxing scheme does not produce any anomalous page faulting behavior.
![]()
![]()
![]()
Next: Constraining available network bandwidth
Up: Implementation on Windows NT
Previous: Constraining use of CPU