


Next: Testing Different Feature Construction
Up: Analyzing System Logs: A
Previous: Ranking Messages by Exceptionality
Using Rank Correlation for Feature Construction
In the original feature-set of our dataset, system log  is represented as the message count vector
  defined above. There are
  message types in our dataset, hence this results in a
 matrix. This matrix is very sparse; only about 0.6% of the entries are non-zero. The high dimensionality of the data and its sparseness make k-means clustering impractical for this representation.
Since our objective is message ranking, we propose a new feature construction scheme of the system-log dataset that measures the difference in the ranking of messages between system logs. Two known rank correlation measures can be used to achieve this: The Spearman rank correlation [12] and Kendall's tau rank correlation [12].
Let
matrix. This matrix is very sparse; only about 0.6% of the entries are non-zero. The high dimensionality of the data and its sparseness make k-means clustering impractical for this representation.
Since our objective is message ranking, we propose a new feature construction scheme of the system-log dataset that measures the difference in the ranking of messages between system logs. Two known rank correlation measures can be used to achieve this: The Spearman rank correlation [12] and Kendall's tau rank correlation [12].
Let  and
and  be vectors of dimension
  . Let
. Let  and
and  be vectors of ranks for and , i.e.
![$ r_x\!\left[i\right] = k$](img25.png) if
if
![$ x\!\left[i\right]$](img26.png) is the
is the  'th largest number in , and similarly for .3
The two correlation measures are defined as follows:
'th largest number in , and similarly for .3
The two correlation measures are defined as follows:
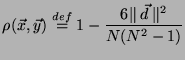
Definition 1 (Spearman Rank Correlation)
Let

.
The Spearman rank Correlation between
and
is defined by:
 |
(1) |
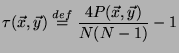
Definition 2 (Kendall's Tau Rank Correlation)
Let

be the number of pairs

such that both
![$ r_x\!\left[i\right]>r_x\!\left[j\right]$](img32.png)
and
![$ r_y\!\left[i\right]>r_y\!\left[j\right]$](img33.png)
.
Kendall's tau rank correlation between
and
is defined by:
 |
(2) |
We first define a new Spearman-based feature-set. In this feature-set, system log is represented by the vector
 , where is the number of samples in our dataset. A Kendall's-tau-based feature-set can be generated in an analogous way. The resulting matrix is a sample correlation matrix, and the new feature-set has dimensions instead of the much larger
  (the number of different message types in the dataset). It is generally expected that in a typical dataset, would be much larger than as it is in our own dataset, because of the diversity of possible messages in a computer system.
It is interesting to note that using either the Spearman-based feature-set or the Kendall's-tau-based feature set generates a kernel similarity matrix for the original dataset. This opens the possibility of using these correlation measures in kernel-based algorithms [9]. We prove that both sample correlation matrices are kernel matrices, using the fact that a kernel matrix is a Positive Semi-Definite (PSD) matrix. A matrix
(the number of different message types in the dataset). It is generally expected that in a typical dataset, would be much larger than as it is in our own dataset, because of the diversity of possible messages in a computer system.
It is interesting to note that using either the Spearman-based feature-set or the Kendall's-tau-based feature set generates a kernel similarity matrix for the original dataset. This opens the possibility of using these correlation measures in kernel-based algorithms [9]. We prove that both sample correlation matrices are kernel matrices, using the fact that a kernel matrix is a Positive Semi-Definite (PSD) matrix. A matrix  is PSD if for any non-zero vector
  ,
,
 [9].
We first prove that the Pearson Sample Correlation matrix [12] is PSD, and then conclude that so are the Spearman rank correlation matrix and the Kendall's-tau sample correlation matrix.
[9].
We first prove that the Pearson Sample Correlation matrix [12] is PSD, and then conclude that so are the Spearman rank correlation matrix and the Kendall's-tau sample correlation matrix.
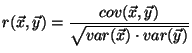
Definition 3 (Pearson Sample Correlation)
Let
and
be vectors of the same dimension.
The Pearson correlation coefficient is defined by:
 |
(3) |
where

is the sample covariance function and

is the sample variance function.
Theorem 1
A Pearson sample correlation matrix is PSD.
Proof.
Let

be a matrix in which each row is a sample. Let

be a diagonal matrix such that entry

is the variance of row
in
. Assume, without loss of generality, that the mean of each sample in
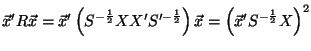
is zero. Then the Pearson correlation matrix can be written in vector form as:
For any non-zero vector
, the expression

can be written as:
 |
(4) |
The rightmost element is a square term, hence it is greater than or equal to zero. Therefore

is PSD.

Theorem 2
A Spearman rank correlation matrix is PSD.
Proof.
Spearman correlation is Pearson correlation applied to ranks [
4]. Therefore, the Spearman rank correlation matrix is PSD.
Theorem 3
A Kendall's-tau correlation matrix is PSD.
Proof.
For a vector
of dimension
, let

of dimension

be defined by:
![$\displaystyle x_K\!\left[j+(i-1)\cdot N\right] =
\left\{
\begin{array}{ll}
...
...i\right]>r_x\!\left[j\right]
0 & \textrm{otherwise}
\end{array}
\right.$](img52.png) |
(5) |
Then
![$ P(\vec{x},\vec{y}) = \sum_{k=1}^{N^2}x_K\!\left[k\right]\cdot y_K\!\left[k\right]$](img53.png)
, and it can be easily verified that Kendall's tau correlation of
and
is the Pearson correlation of

and

, for

a constant that depends on
. Hence, Kendall's tau correlation matrix is also a Pearson correlation matrix, and so it is PSD.
Next: Testing Different Feature Construction
Up: Analyzing System Logs: A
Previous: Ranking Messages by Exceptionality
2007-03-12