
The DITOOLS infrastructure enables qualitative benefits, namely richer functionality and ease of extension, that are hard to measure. In this section, we will focus on the overhead of adding new functionality, regardless of the beneficial counterparts, and we found it quite reasonable. Nevertheless, we believe that performance is not always the primary concern.
We have designed a worst-case experiment (the `Forward' experiment) that redefines all the available dynamically-linked definitions within a given process to a simple extension that merely forwards the call to the original definition. This includes all definitions of the standard C run-time library as well as those included in any other library used by the program. By comparing the results to the execution of the unmodified program (the `Baseline' experiment), we evaluate the overhead of using DITOOLS. Typical uses of DITOOLS (like those described in section 4) only need to interpose code to very few calls.
The programs used in our tests come from the SPEC95 benchmark suite, using the `train' input dataset. Our experimental environment is based on a 64-processor Origin2000 system, from Silicon Graphics Inc. This machine runs the IRIX Operating System, release 6.5.3.
In programs enhanced by our infrastructure we expect to observe two effects on performance: an increase in startup time due to extra processing, and some overhead during execution due to the additional indirection.
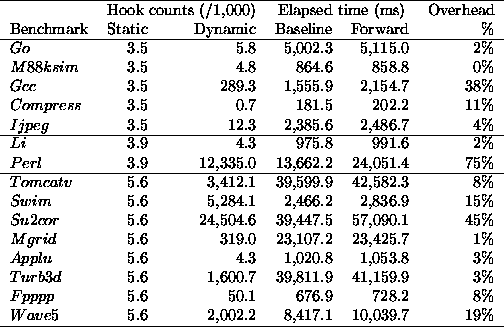
Table 1: Impact of interposition on program execution
Results summarized in Table 1 come from the average of 4 executions of each benchmark, running on a dedicated processor of the machine, to minimize the effects of cold start and interferences from other processes. This table shows, for each program, the number of statically available dynamically-linked references (static hooks), how many times these hooks are triggered at runtime (dynamic activation count), the elapsed time for the unmodified execution environment (baseline), and the elapsed time when invoking the empty wrapper at every call.
The static hooks count column gives an idea of the work done by the DI runtime at startup. As many bindings as listed in this column are modified to invoke the extension. This classifies the benchmarks in three groups, according to the number of exposed hooks. Benchmarks that need the same libraries expose the same number of hooks. Given that the startup time is basically constant (around 30 microseconds/hook), we do not show it in the table. It ranges from 140 ms for the first five benchmarks (3,500 exposed hooks) to 150 ms for the last 8 benchmarks (5,600 exposed hooks).
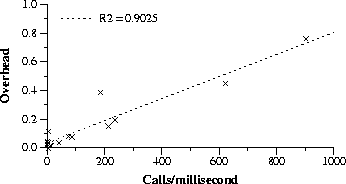
Last three columns show the elapsed time for baseline and forward, and the corresponding overhead. The overhead of DITOOLS is proportional to the dynamic count of hook calls. In many cases it is less than 10%. However, benchmarks that are making a high number of calls to the extension, relative to their execution time, become more affected by interposition. This is simply the scaled effect of this high number of calls per millisecond (c/ms). For instance, if we compute this number for perl and su2cor, we obtain 902 c/ms for perl and 621 c/ms for su2cor. Both programs follow the correlation between calls per millisecond and overhead seen in the other programs. Take, for instance, turb3d, which has an overhead of 3%. It does 40 c/ms, so this makes 1,013 c/ms for 76% and 613 for 46%, which are close to the values observed for perl and su2cor. The measured correlation coefficient between overhead and calls per millisecond is 0.9 (see the regression plot in Figure 4). It is worth to mention that we are describing a worst-case experiment, in which the extension interposes to all the available hooks.

Figure 4: Overhead vs. calls per millisecond
Table 2: Space requirements of modules used in this evaluation
Table 2 depicts the space requirements of the DI runtime and the other extensions used in this evaluation, as well as the average size of the benchmarks. This table shows, for each module, its static size in disk as well as the size of all the virtual memory regions required to hold its code and data within the process address space at run-time. The `count' extension has been used to compute the columns labeled `hook counts' in Table 1, the `forward' extension corresponds to the `forward' experiment, and the `monitoring' extension to the `monitoring' experiment.
The dynamic sizes have been obtained by measuring the number of pages allocated in the virtual process address-space, and then using the page size (16K) to compute the dynamic size. The space overhead at run-time is about 15%. We should take into account that benchmarks are running with a relatively small input (`train').
The second experiment (the `Monitoring' experiment) compares the performance of a fully-featured extension using DITOOLS, against the same functionality introduced by changing the source code. The experiment introduces a performance monitoring extension that collects the execution trace of a parallel program. This trace contains thread creation, thread joining and synchronization events. More information on this experience can be found in another paper [10].
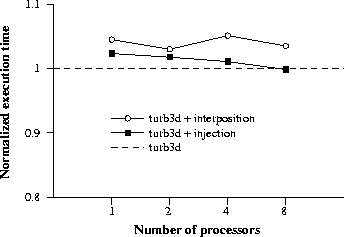
For this experiment, we use a parallelized version of the turb3d benchmark. Figure 5 shows the impact of both alternatives. The dashed line represents the normalized execution time for the uninstrumented version of this benchmark, using from 1 to 8 processors. Solid lines represent the normalized execution time for the instrumented versions. As can be observed, interposition-based instrumentation performs comparably to the static code modification approach. In both cases, the overhead is less than 5% of the execution time for any number of processors.

Figure 5: Impact of a fully-featured extension on execution time
At a first glance, one can think that all these enhancements always come at the price of performance. In another experiment, we used interposition to enhance the performance by caching the results of frequently used functions [17]. In this way we were able to reduce the execution time by 8% for those library functions. This demonstrates that extending the execution environment not always degrades performance.
Finally, remember that, although this section focuses on the costs of adding new functionality using DITOOLS, this infrastructure is intended to support extension and flexible composition. Therefore, performance will not always be the primary concern. In many cases, the infrastructure will not be used to add functionality but to select among multiple implementations (thus, not adding extra indirections), and it may even pay using it in terms of performance.