 |

The quantitative restriction of interest here is the amount of physical memory an application can use. The sandbox would ensure that physical memory allocated to the application does not exceed a prescribed threshold. Monitoring the amount of physical memory allocated to an application is straightforward. The monitoring infrastructure on all modern OSes provides this information in the form of the process working set (resident set) size. The progress metric is the application's peak working set size over a period. No control is necessary when the progress is less than the threshold.
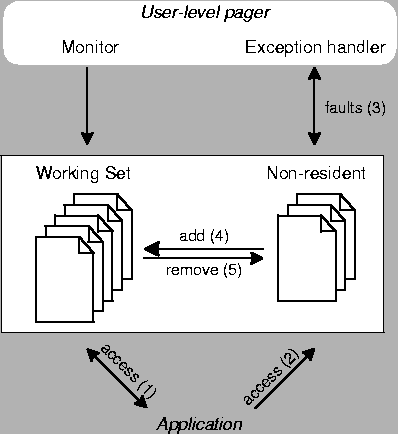
However, it is more involved to control the application behavior in case the OS allocates more physical pages than the threshold. The problem is that these resources are allocated implicitly subject to the OS memory management policies. The basic idea is to have the monitor act as a user-level pager on top of the OS-level pager, relying on an OS-specific protocol for voluntarily relinquishing the surplus physical memory pages allocated to the application (see Figure 2). Also, unlike the CPU case where periodic monitoring and control of application progress is required, here the monitoring and control can adapt itself to application behavior. The latter is required only if the application physical memory usage exceeds the prescribed threshold, which in turn can be detected by exploiting OS support for user-level protection fault handlers.
 |