 |

In order to measure the overhead of using MULTIVIEW we used a standalone test application which is not related to the MILLIPAGE system. In this way the overhead of MULTIVIEW could be distinguished from that of other implementation-related sources.
Our test application allocates an array of characters (bytes). The array resides in minipages of equal size. The number of minipages in each page is equal to the number of views. The main application routine iteratively traverses the array, reading each element (from first to last) exactly once in each iteration. We experiment with two parameters: the size of the array (which represents the size of the shared memory), N, and the number of views n.
 |
As expected, the total size of committed memory increases with the size of
the allocated region, independent of the number of views.
We were limited, however, by the size of the available virtual
address space, which stands at about 1.63 GB.
Thus, we could only experiment with
![]() (e.g., for
(e.g., for
![]() we could set up to n=104 views).
we could set up to n=104 views).
For
![]() we hardly noticed any overhead.
For
we hardly noticed any overhead.
For
![]() the measured overhead is always less than 4% for
the measured overhead is always less than 4% for
![]() .
Note that n=32 means a sharing granularity of 128 bytes.
.
Note that n=32 means a sharing granularity of 128 bytes.
In order to study the limitations of the MULTIVIEW technique we also
experimented with a very large number of views, up to 1664.
The results show that, at certain breaking-points, the overhead of
using many views becomes substantial and may lead to severe slowdown.
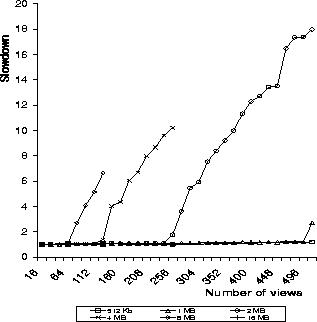
Figure 5 summarizes the results up to 512
views (minipages of size 8 bytes).
Taking a closer look at the graphs, we could make several observations.
First, for each N, beyond the breaking-point, the overhead increases
linearly with the number of views.
Second, beyond their respective breaking-points, the graphs for all Nincrease with the same slope.
Third, the breaking-points themselves depend on N in an
approximately inversely-linear fashion: they appear at the points where
![]() (N in MB).
Finally,
when we tried to allocate a large N and use only a fraction of it,
the breaking-point appeared earlier than in the case where only the
accessed fraction was allocated.
(N in MB).
Finally,
when we tried to allocate a large N and use only a fraction of it,
the breaking-point appeared earlier than in the case where only the
accessed fraction was allocated.
Our first explanation is that the slowdown is related to the enormous increase in TLB misses, and to the size of the cache. The number of active PT entries (not MPT) at the breaking points becomes 128K. The TLB size in the Pentium II is 64 data entries and 32 code entries. A PTE is four bytes in size, and the PTEs are cachable. A TLB miss and a 1st level cache miss cause a single stall; an increase there may thus explain the 1-4% slowdown we experienced with smaller N and n, but cannot possibly explain the slowdown that appears beyond the breaking-points.
The size of the 2nd level cache in our machines is 512KB, thus the breaking-points occur precisely when the PTEs can no longer be cached there. The cache is physically tagged. Attempting to access a new minipage causes the virtual memory translation mechanism to search for a new PTE, which, when the cache is congested, causes a miss. In the extreme situations that we tested, beyond the breaking-points, the cache misses caused by the missing PTEs dominate the cache activity.
We note here that other factors might also have affected the performance of MULTIVIEW. One example is a possible performance degradation caused by overloading the operating system's internal data structures, keeping track of extensive data mapping. Another example is the quicker cache exhaustion that may occur in virtually tagged caches.
As we describe later in this section, the applications in our benchmark suite all use less than 32 views and thus the overhead they experience is negligible.