 |

 |
For the benchmark, we placed the observer at 22 locations on the
grid
![]() in the base station
coordinate system on the floor of the room. At each of the locations,
we measured the location ten times by iteratively solving Equation
System 10 as described in Section 4.2.
in the base station
coordinate system on the floor of the room. At each of the locations,
we measured the location ten times by iteratively solving Equation
System 10 as described in Section 4.2.
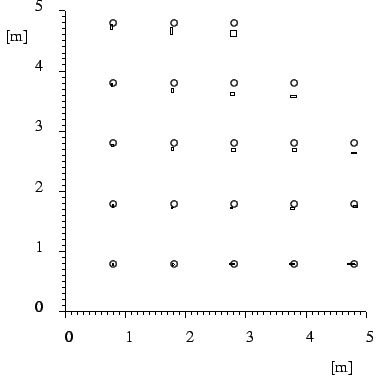
Figure 11 shows the base station coordinate system
and the results of these measurements. Ground truth locations ![]() are indicated by circles. The mean of the computed location
are indicated by circles. The mean of the computed location
![]() is at the center of the small boxes. The edge length of each
box is twice the standard deviation
is at the center of the small boxes. The edge length of each
box is twice the standard deviation ![]() (
(![]() ) of the measurements
in the respective axis.
) of the measurements
in the respective axis.
Please note that we determined ground truth locations using a cheap 5m
tape measure, resulting in a maximum error of about ![]() cm in each
axis. Also note that we did not perform out-lier rejection or any other
statistical ``tricks'' to improve the mean values or standard
deviations.
cm in each
axis. Also note that we did not perform out-lier rejection or any other
statistical ``tricks'' to improve the mean values or standard
deviations.
The mean relative offset of the mean locations from ground truth
locations (i.e.,
![]() ) is 1.1% in the
) is 1.1% in the ![]() axis, and
2.8% in the
axis, and
2.8% in the ![]() axis. The overall mean relative offset of the mean
locations from ground truth locations (i.e.,
axis. The overall mean relative offset of the mean
locations from ground truth locations (i.e.,
![]() is 2.2%. The mean relative standard
deviation (i.e.,
is 2.2%. The mean relative standard
deviation (i.e., ![]() ) is 0.71% in the
) is 0.71% in the ![]() axis and 0.74% in
the
axis and 0.74% in
the ![]() axis. The overall mean relative standard deviation
(i.e.,
axis. The overall mean relative standard deviation
(i.e.,
![]() ) is 0.68%.
) is 0.68%.
Note that while the mean standard deviations are almost the same for
both axes, the mean relative offset of 2.8% in the ![]() axis is more
than twice the value for the
axis is more
than twice the value for the ![]() axis. We believe that this is due to
the way we performed calibration. Firstly, some of the locations where
we performed measurements are outside of the convex hull of the
locations where we performed calibration. Additionally, we calibrated
at only four locations and solved Equation System 12
directly in order to obtain the
axis. We believe that this is due to
the way we performed calibration. Firstly, some of the locations where
we performed measurements are outside of the convex hull of the
locations where we performed calibration. Additionally, we calibrated
at only four locations and solved Equation System 12
directly in order to obtain the ![]() values. We expect better
results by performing calibration using a larger set of reference
locations and by using MMSE methods as mentioned in Section
4.2. We are currently working on improving the
calibration part of our software.
values. We expect better
results by performing calibration using a larger set of reference
locations and by using MMSE methods as mentioned in Section
4.2. We are currently working on improving the
calibration part of our software.