 |

We have implemented an integrated tool-based approach for performance measurement of ORB endsystem performance. The single most important aspect of our system is that it measures performance within the target environment, rather than relying on published data that may be inaccurate, or which accurately describes aspects of performance under a different environment. The main features of this approach are:
The performance metrics which best predict application performance depend, in part, on the properties of the application. This is one reason why a pattern based and automated framework is required. The pattern orientation enables the user to describe scenarios with a rich and varied set of behaviors and requirements, closely matching the proposed application architecture. Automation enables testing on a large scale, permitting the user to test a wide range of parameters under a wide range of conditions, which permits the user to avoid making many potentially unjustified assumptions about what aspects of the application, ORB, and endsystem are important in determining performance.
The metrics which will be crucial for important classes of applications include: throughput, latency, scalability, reliability and memory use. The system parameters which can affect application performance with respect to these metrics include: multi-threading, marshalling and demarshalling overhead, demultiplexing and dispatching overhead, operating system scheduling, integration of I/O and scheduling, and network latency. Our approach currently enables us to examine the influence of many of these aspects of the system on performance, and further development will enable us to handle all of them.
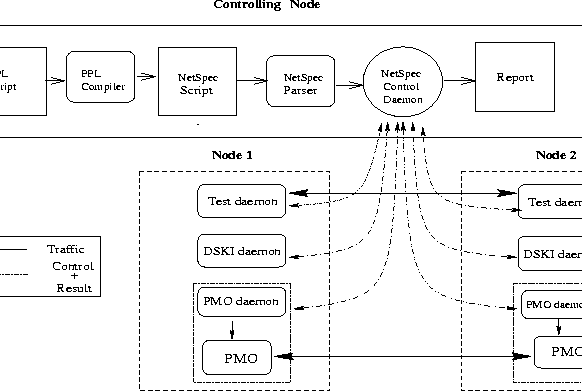
Figure 1 shows our integrated benchmarking framework supporting performance evaluation tests. The experiment description expressed in the PPL script is parsed by the PPL compiler which emits a PMO NetSpec script implementing the specified experiment. The NetSpec parser processes the PMO based script and instructs the NetSpec controller daemon to create the specified sets of daemons on each host used by the distributed experiment. Note that Figure 1 illustrates a generic set of daemons, rather than those supporting a specific test. The PMO daemon interfaces the CORBA based objects on that host to the NetSpec controlling daemon. An additional PMO object is sometimes used, and communicates with the PMO daemon, because CORBA objects can be created dynamically. Note that the line between the PMO objects represents their CORBA based interaction, which is the focus of the experiment. The DSKI measurement daemon, if present, is used to gather performance data from the operating system. It is a generic daemon and is not CORBA based. The traffic daemon is also not CORBA based, but is used to create a context of system load and background traffic within which the CORBA objects exist.
Our approach integrates several existing tools and adds significant new abilities specifically to support CORBA. The tools integrated under this framework are NetSpec[12,16], the Data Stream Kernel Interface (DSKI)[1], the Performance Measurement Object (PMO)[10,9], and the Performance Pattern Language (PPL). The rest of this section discussed each component in greater detail.