
This section presents our performance measurements of Fast Sockets, both for microbenchmarks and a few applications. The microbenchmarks assess the success of our efforts to minimize overhead and round-trip latency. We report round-trip times and sustained bandwidth available from Fast Sockets, using both our own microbenchmarks and two publicly available benchmark programs. The true test of Fast Sockets' usefulness, however, is how well its raw performance is exposed to applications. We present results from an FTP application to demonstrate the usefulness of Fast Sockets in a real-world environment.
Fast Sockets has been implemented using Generic Active Messages (GAM) [Culler et al. 1994] on both HP/UX 9.0.x and Solaris 2.5. The HP/UX platform consists of two 99Mhz HP735's interconnected by an FDDI network and using the Medusa network adapter [Banks & Prudence 1993]. The Solaris platform is a collection of UltraSPARC 1's connected via a Myrinet network [Seitz 1994]. For all tests, there was no other load on the network links or switches.
Our microbenchmarks were run against a variety of TCP/IP setups. The standard HP/UX TCP/IP stack is well-tuned, but there is also a single-copy stack designed for use on the Medusa network interface. We ran our tests on both stacks. While the Solaris TCP/IP stack has reasonably good performance, the Myrinet TCP/IP drivers do not. Consequently, we also ran our microbenchmarks on a 100-Mbit Ethernet, which has an extremely well-tuned driver.
We used Generic Active Messages 1.0 on the HP/UX platform as a base for Fast Sockets and as our Active Messages layer. The Solaris tests used Generic Active Messages 1.5, which adds support for medium messages (receiver-based memory management) and client-server program images.
Our round-trip microbenchmark is a simple ping-pong test between two
machines for a given transfer size. The ping-pong is repeated until a 95%
confidence interval is obtained. TCP/IP and Fast Sockets use the same program,
Active Messages uses different code but the same algorithm. We used the
TCP/IP TCP_NODELAY option to force packets to be transmitted as
soon as possible (instead of the default behavior, which attempts to batch
small packets together); this reduces throughput for small transfers, but
yields better round-trip times. The socket buffer size was set to 64 Kbytes![]() ,
as this also improves TCP/IP round-trip latency. We tested TCP/IP and Fast
Sockets for transfers up to 64 Kbytes; Active Messages only supports 4
Kbyte messages.
,
as this also improves TCP/IP round-trip latency. We tested TCP/IP and Fast
Sockets for transfers up to 64 Kbytes; Active Messages only supports 4
Kbyte messages.
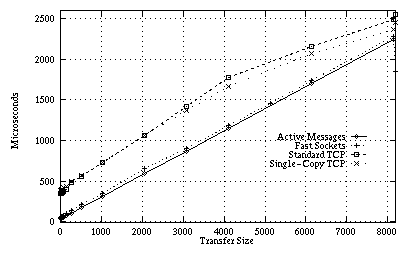
Figure 3: Round-trip performance for
Fast Sockets, Active Messages, and TCP for the HP/UX/Medusa platform. Active
Messages for HP/UX cannot transfer more than 8140 bytes at a time.
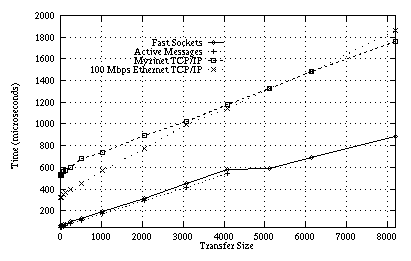
Figure 4: Round-trip performance
for Fast Sockets, Active Messages, and TCP on the Solaris/Myrinet platform.
Active Messages for Myrinet can only transfer up to 4096 bytes at a time.
Figures 3 and 4 present the results of the round-trip microbenchmark. Fast Sockets achieves low latency round-trip times, especially for small packets. Round-trip time scales linearly with increasing transfer size, reflecting the time spent in moving the data to the network card. There is a ``hiccup'' at 4096 bytes on the Solaris platform, which is the maximum packet size for Active Messages. This occurs because Fast Sockets' fragmentation algorithm attempts to balance packet sizes for better round-trip and bandwidth characteristics. Fast Sockets' overhead is low, staying relatively constant at 25-30 microseconds (over that of Active Messages).
| Layer |
Per-Byte |
t0 |
Actual Startup Cost |
| Fast Sockets |
0.068 |
157.4 |
57.8 |
| Active Messages |
0.129 |
38.9 |
45.0 |
| TCP/IP (Myrinet) |
0.076 |
736.4 |
533.4 |
| TCP/IP (Fast Ethernet) |
0.174 |
366.2 |
326.0 |
|
Small Packets |
|||
| Fast Sockets |
0.124 |
61.4 |
57.8 |
| Active Messages |
0.123 |
45.4 |
45.0 |
| TCP/IP (Myrinet) |
0.223 |
533.0 |
533.0 |
| TCP/IP (Fast Ethernet) |
0.242 |
325.0 |
326.0 |
Table 1: Least-squares analysis
of the Solaris round-trip microbenchmark. The per-byte and estimated startup
(t0) costs are for round-trip latency, and are measured in microseconds.
The actual startup costs (for a single-byte message) are also shown. Actual
and estimated costs differ because round-trip latency is not strictly linear.
Per-byte costs for Fast Sockets are lower than for Active Messages because
Fast Sockets benefits from packet pipelining; the Active Messages test
only sends a single packet at a time. ``Small Packets'' examines protocol
behavior for packets smaller than 1K; here, Fast Sockets and Active Messages
do considerably better than TCP/IP.
Table 1 shows the results of a least-squares linear regression analysis of the Solaris round-trip microbenchmark. We show t0, the estimated cost for a 0-byte packet, and the marginal cost for each additional data byte. Surprisingly, Fast Sockets' cost-per-byte appears to be lower than that of Active Messages. This is because the Fast Sockets per-byte cost is reported for a 64K range of transfers while Active Messages' per-byte cost is for a 4K range. The Active Messages test minimizes overhead by not implementing in-order delivery, which means only one packet can be outstanding at a time. Both Fast Sockets and TCP/IP provide in-order delivery, which enables data packets to be pipelined through the network and thus achieve a lower per-byte cost. The per-byte costs of Fast Sockets for small packets (less than 1 Kbyte) are slightly higher than Active Messages. While TCP's long-term per-byte cost is only about 15% higher than that of Fast Sockets, its performance for small packets is much worse, with per-byte costs twice that of Fast Sockets and startup costs 5-10 times higher.
Another surprising element of the analysis is that the overall t0and t0for small packets is very different, especially for Fast Sockets and Myrinet TCP/IP. Both protocols pipeline packets, which lowers round-trip latencies for multi-packet transfers. This causes a non-linear round-trip latency function, yielding different estimates of t0for single-packet and multi-packet transfers.
Our bandwidth microbenchmark does 500 send() calls of a given size, and then waits for a response. This is repeated until a 95% confidence interval is obtained. As with the round-trip microbenchmark, the TCP/IP and Fast Sockets measurements were derived from the same program and Active Messages results were obtained using the same algorithm, but different code. Again, we used the TCP/IP TCP_NODELAY option to force immediate packet transmission, and a 64 Kbyte socket buffer.
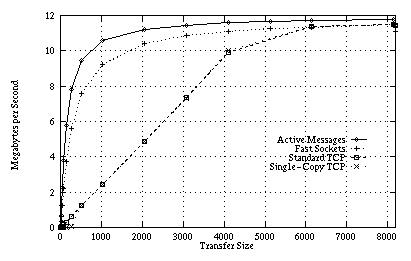
Figure 5: Observed bandwidth for Fast
Sockets, TCP, and Active Messages on HP/UX with the Medusa FDDI network
interface. The memory copy bandwidth of the HP735 is greater than the FDDI
network bandwidth, so Active Messages and Fast Sockets can both realize
close to the full bandwidth of the network.
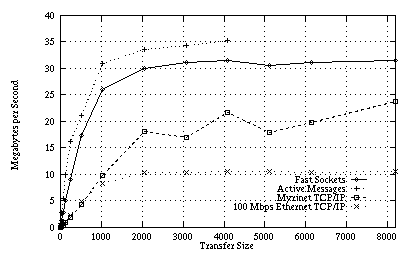
Figure 6: Observed bandwidth for
Fast Sockets, TCP, and Active Messages on Solaris using the Myrinet local-area
network. The bus limits maximum throughput to 45 MB/s. Fast Sockets is
able to realize much of the available bandwidth of the network because
of receive posting.
Results for the bandwidth microbenchmark are shown in Figures 5 and 6. Fast Sockets is able to realize most of the available bandwidth of the network. On the UltraSPARC, the SBus is the limiting factor, rather than the network, with a maximum throughput of about 45 MB/s. Of this, Active Messages exposes 35 MB/s to user applications. Fast Sockets can realize about 90% of the Active Messages bandwidth, losing the rest to memory movement. Myrinet's TCP/IP only realizes 90% of the Fast Sockets bandwidth, limited by its high processing overhead.
Table 2 presents the results of
a least-squares fit of the bandwidth curves to the equation
y = (Rmax * x) / (N(0.5) + x)
which describes an idealized bandwidth curve. Rmax is the theoretical maximum bandwidth realizable by the communications layer, and N(0.5) is the half-power pointof the curve. The half-power point is the transfer size at which the communications layer can realize half of the maximum bandwidth. A lower half-power point means a higher percentage of packets that can take advantage of the network's bandwidth. This is especially important given the frequency of small messages in network traffic. Fast Sockets' half-power point is only 18% larger than that of Active Messages, at 441 bytes. Myrinet TCP/IP realizes a maximum bandwidth 10% less than Fast Sockets but has a half-power point four times larger. Consequently, even though both protocols can realize much of the available network bandwidth, TCP/IP needs much larger packets to do so, reducing its usefulness for many applications.
| Layer | Rmax (MB/s) |
N(0.5) (bytes) |
| Fast Sockets |
32.9 |
441 |
| Active Messages |
39.2 |
372 |
| TCP/IP (Myrinet) |
29.6 |
2098 |
| TCP/IP (Ethernet) |
11.1 |
530 |
Table 2: Least-squares regression
analysis of the Solaris bandwidth microbenchmark. Rmaxis the maximum bandwidth
of the network and is measured in megabytes per second. The half-power
point (N(0.5)) is the packet size that delivers half of the maximum throughput,
and is reported in bytes. TCP/IP was run with the TCP_NODELAY
option, which attempts to transmit packets as soon as possible rather than
coalescing data together.
Two commonly used microbenchmarks for evaluating network software are netperf and ttcp. Both of these benchmarks are primarily designed to test throughput, although netperf also includes a test of request-response throughput, measured in transactions/second.
We used a version 1.2 of ttcp, modified to work under Solaris, and netperf 2.11 for testing. The throughput results are shown in Figure 7, and our analysis is in Table 3.
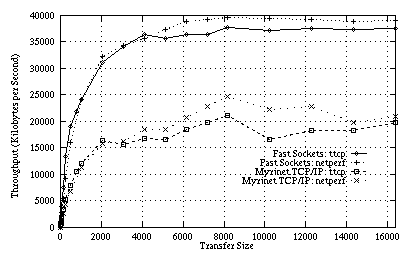
Figure 7:
Ttcp and netperf bandwidth measurements on Solaris for
Fast Sockets and Myrinet TCP/IP.
| Layer | Rmax (MB/s) |
N(0.5) (bytes) |
| ttcp | ||
| Fast Sockets |
38.57 |
560.7 |
| TCP/IP (Myrinet) |
19.59 |
687.5 |
| netperf | ||
| Fast Sockets |
41.57 |
785.7 |
| TCP/IP (Myrinet) |
23.72 |
1189 |
Table 3:
Least-squares regression analysis of the ttcp and netperf
microbenchmarks. These tests were run on the Solaris 2.5.1/Myrinet platform.
TCP/IP half-power point measures are lower than in Table 2
because both ttcp and netperf attempt to improve small-packet
bandwidth at the price of small-packet latency.
A curious result is that the half-power points for ttcp and netperf are substantially lower for TCP/IP than on our bandwidth microbenchmark. One reason for this is that the maximum throughput for TCP/IP is only about 50-60% that of Fast Sockets. Another reason is that TCP defaults to batching small data writes in order to maximize throughput (the Nagle algorithm) [Nagle 1984], and these tests do not disable the algorithm (unlike our microbenchmarks); however, this behavior trades off small-packet bandwidth for higher round-trip latencies, as data is held at the sender in an attempt to coalesce data.
The netperf microbenchmark also has a ``request-response'' test, which reports the number of transactions per second a communications stack is capable of for a given request and response size. There are two permutations of this test, one using an existing connection and one that establishes a connection every time; the latter closely mimics the behavior of protocols such as HTTP. The results of these tests are reported in transactions per second and shown in Figure 8.
Figure 8 : Netperf measurements
of request-response transactions-per-second on the Solaris platform, for
a variety of packet sizes. Connection costs significantly lower Fast Sockets'
advantage relative to Myrinet TCP/IP, and render it slower than Fast Ethernet
TCP/IP. This is because the current version of Fast Sockets uses the TCP/IP
connection establishment mechanism.
The request-response test shows Fast Sockets' Achilles heel: its connection mechanism. While Fast Sockets does better than TCP/IP for request-response behavior with a constant connection (Figure 8(a)), introducing connection startup costs (Figure 8(b)) reduces or eliminates this advantage dramatically. This points out the need for an efficient, high-speed connection mechanism.
Microbenchmarks are useful for evaluating the raw performance characteristics of a communications implementation, but raw performance does not express the utility of a communications layer. Instead, it is important to characterize the difficulty of integrating the communications layer with existing applications, and the performance improvements realized by those applications. This section examines how well Fast Sockets supports the real-life demands of a network application.
File transfer is traditionally considered a bandwidth-intensive application. However, the FTP protocol that is commonly used for file transfer still has a request-response nature. Further, we wanted to see what improvements in performance, if any, would be realized by using Fast Sockets for an application it was not intended for.
We used the NcFTP ftp client (ncftp), version 2.3.0, and the Washington University ftp server (wu-ftpd), version 2.4.2. Because Fast Sockets currently does not support fork(), we modified wu-ftpd to wait for and accept incoming connections rather than be started from the inetd Internet server daemon.
Our FTP test involved the transfer of a number of ASCII files, of various sizes, and reporting the elapsed time and realized bandwidth as reported by the FTP client. On both machines, files were stored in an in-memory filesystem, to avoid the bandwidth limitations imposed by the disk.
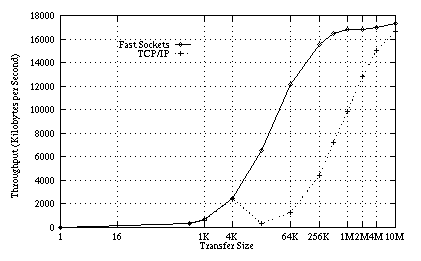
Figure 9: Relative throughput
realized by Fast Sockets and TCP/IP versions of the FTP file transfer protocol.
Connection setup costs dominate the transfer time for small files and the
network transport serves as a limiting factor for large files. For mid-sized
files, Fast Sockets is able to realize much higher bandwidth than TCP/IP.
The relative throughput for the Fast Sockets and TCP/IP versions of the FTP software is shown in Figure 9. Surprisingly, Fast Sockets and TCP/IP have roughly comparable performance for small files (1 byte to 4K bytes). This is due to the expense of connection setup - every FTP transfer involves the creation and destruction of a data connection. For mid-sized transfers, between 4 Kbytes and 2 Mbytes, Fast Sockets obtains considerably better bandwidth than normal TCP/IP. For extremely large transfers, both TCP/IP and Fast Sockets can realize a significant fraction of the network's bandwidth.