To gauge the effectiveness of CoDNS, we compare its behavior with local DNS on CoDeeN's live traffic using a variety of metrics. CoDeeN receives 5-7 million requests daily from a world-wide client population of 7-12K users. These users have explicitly specified CoDeeN proxies in their browser, so all of their Web traffic is directed through CoDeeN. The CoDeeN proxies maintain their own DNS caches, so only uncached DNS names cause lookups. To eliminate the possible caching effect on a nameserver from other users sharing the same server, we measure both times only in CoDNS, using the slaves to indicate local DNS performance.
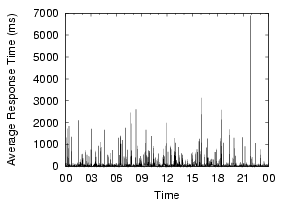
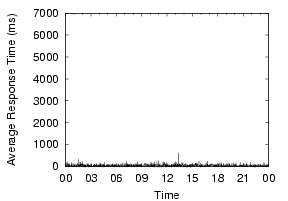
CoDNS effectively removes the spikes in the response time, and provides more reliable and predictable service for name lookups. Figure 13 compares per-minute average response times of local DNS and CoDNS for CoDeeN's live traffic for one day on one PlanetLab node. While local DNS shows response time spikes of 7 seconds, CoDNS never exceeds 0.6 seconds. The benefit stems from redirecting slow lookups to working peers.
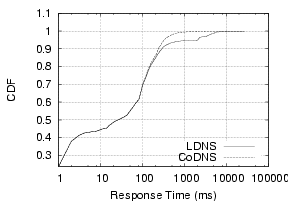
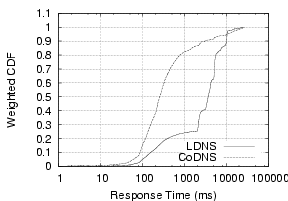
The greater benefit of CoDNS lies in reducing the frequency of slow responses. Figure 14 shows a CDF and a weighted CDF for name lookup response distribution for the same node for one week. The CDF graph shows that the response distribution in both schemes is almost similar until the 90th percentile, but CoDNS reduces the lookups taking more than 1000ms from 5.5% to 0.6%. This reduction gives much benefit in total lookup time in the weighted CDF. It shows CoDNS now spends 18% of total time in lookups taking more than 1000ms, while local DNS still spends 75% of the total time on them.
|
|
This improvement is widespread - Figure 15(a) shows the statistics of 95 CoDeeN nodes for the same period. The average number of total lookups per node is 22,208, ranging from 12,119 to 131,466 per node. The average response time in CoDNS is 60-221ms, while that of local DNS is 113-935ms. In all cases, CoDNS's response is faster, ranging from a factor of 1.37 to 5.42. Figure 15(b) shows the percentage of slow responses in the total response time. CoDNS again reduces the slow response's portion dramatically to less than 20% of the total lookup time in most cases, delivering more predictable response time. In contrast, local DNS spends 37% to 85% of the total time in the slow queries.
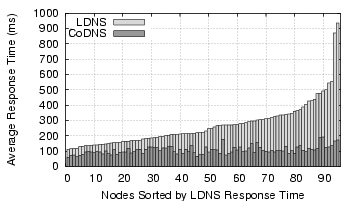 (a) Average Response Time
|
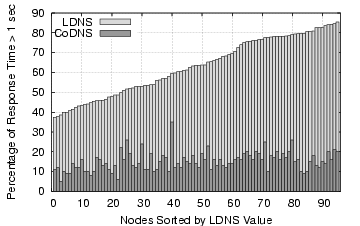 (b) Slow Response Time
portion
|