

Next: 7 I/O Page Remapping
Up: 6 Allocation Policies
Previous: 6.2 Admission Control
ESX Server recomputes memory allocations dynamically in response to various
events: changes to system-wide or per-VM allocation parameters by a
system administrator, the addition or removal of a VM from the system,
and changes in the amount of free memory that cross predefined
thresholds. Additional rebalancing is performed periodically to
reflect changes in idle memory estimates for each VM.
Most operating systems attempt to maintain a minimum amount of free
memory. For example, BSD Unix normally starts reclaiming memory when
the percentage of free memory drops below 5% and continues
reclaiming until the free memory percentage reaches 7%
[18]. ESX Server employs a similar approach, but uses four
thresholds to reflect different reclamation states: high,
soft, hard, and low, which default to 6%, 4%,
2%, and 1% of system memory, respectively.
In the the high state, free memory is sufficient and no
reclamation is performed. In the soft state, the system
reclaims memory using ballooning, and resorts to paging only in cases
where ballooning is not possible. In the hard state, the
system relies on paging to forcibly reclaim memory. In the rare event
that free memory transiently falls below the low threshold,
the system continues to reclaim memory via paging, and additionally
blocks the execution of all VMs that are above their target
allocations.
In all memory reclamation states, the system computes target
allocations for VMs to drive the aggregate amount of free space above
the high threshold. A transition to a lower reclamation state
occurs when the amount of free memory drops below the lower threshold.
After reclaiming memory, the system transitions back to the next
higher state only after significantly exceeding the higher threshold;
this hysteresis prevents rapid state fluctuations.
 |
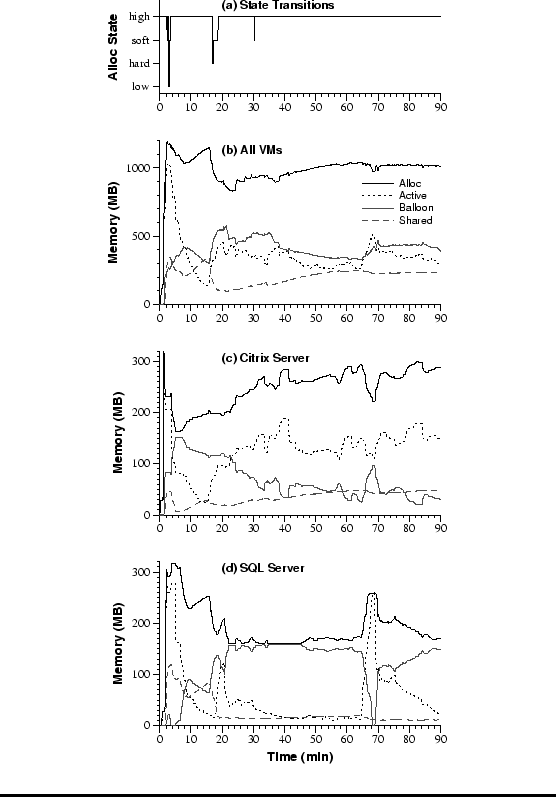
| Figure 8:
Dynamic Reallocation.
Memory allocation metrics over time for a consolidated
workload consisting of five Windows VMs: Microsoft Exchange (separate
server and client load generator VMs), Citrix MetaFrame (separate
server and client load generator VMs), and Microsoft SQL Server. (a)
ESX Server allocation state transitions. (b) Aggregate allocation metrics
summed over all five VMs. (c) Allocation metrics for MetaFrame Server
VM. (d) Allocation metrics for SQL Server VM. |
To demonstrate dynamic reallocation we ran a workload consisting of
five virtual machines. A pair of VMs executed a Microsoft Exchange
benchmark; one VM ran an Exchange Server under Windows 2000 Server,
and a second VM ran a load generator client under Windows 2000
Professional. A different pair executed a Citrix MetaFrame benchmark;
one VM ran a MetaFrame Server under Windows 2000 Advanced Server, and
a second VM ran a load generator client under Windows 2000 Server. A
final VM executed database queries with Microsoft SQL Server under
Windows 2000 Advanced Server. The Exchange VMs were each configured
with 256 MB memory; the other three VMs were each configured with
320 MB. The min size for each VM was set to half of
its configured max size, and memory shares were allocated
proportional to the max size of each VM.
For this experiment, ESX Server was running on an IBM Netfinity 8500R
multiprocessor with eight 550 MHz Pentium III CPUs. To facilitate
demonstrating the effects of memory pressure, machine memory was
deliberately limited so that only 1 GB was available for executing
VMs. The aggregate VM workload was configured to use a total of
1472 MB; with the additional 160 MB required for overhead memory,
memory was overcommitted by more than 60%.
Figure 8(a) presents ESX Server allocation states
during the experiment. Except for brief transitions early in the run,
nearly all time is spent in the high and soft
states. Figure 8(b) plots several allocation
metrics over time. When the experiment is started, all five VMs boot
concurrently. Windows zeroes the contents of all pages in
``physical'' memory while booting. This causes the system to become
overcommitted almost immediately, as each VM accesses all of its
memory. Since the Windows balloon drivers are not started until late
in the boot sequence, ESX Server is forced to start paging to disk.
Fortunately, the ``share before swap'' optimization described in
Section 4.3 is very effective: 325 MB of zero pages
are reclaimed via page sharing, while only 35 MB of non-zero data is
actually written to disk.7 As a result of
sharing, the aggregate allocation to all VMs approaches 1200 MB,
exceeding the total amount of machine memory. Soon after booting, the
VMs start executing their application benchmarks, the amount of shared
memory drops rapidly, and ESX Server compensates by using ballooning to
reclaim memory. Page sharing continues to exploit sharing
opportunities over the run, saving approximately 200 MB.
Figures 8(c) and 8(d) show
the same memory allocation data for the Citrix MetaFrame Server VM and
the Microsoft SQL Server VM, respectively. The MetaFrame Server
allocation tracks its active memory usage, and also grows slowly over
time as page sharing reduces overall memory pressure. The SQL Server
allocation starts high as it processes queries, then drops to 160 MB
as it idles, the lower bound imposed by its min size. When a
long-running query is issued later, its active memory increases
rapidly, and memory is quickly reallocated from other VMs.


Next: 7 I/O Page Remapping
Up: 6 Allocation Policies
Previous: 6.2 Admission Control
Carl Waldspurger, OSDI '02

