To test PARDA with more realistic enterprise workloads, we
experimented with two Windows Server 2003 VMs, each running a
Microsoft SQL Server 2005 Enterprise Edition database. Each VM is
configured with 4 virtual CPUs, 6.4 GB of RAM, a 10 GB system disk, a
250 GB database disk, and a 50 GB log disk. The database virtual
disks are hosted on an 800 GB RAID-0 LUN with 6 disks; log virtual
disks are placed on a 100 GB RAID-0 LUN with 10 disks. We used the
Dell DVD store (DS2) database test suite, which implements a complete
online e-commerce application, to stress the SQL
databases [7]. We configured a 15 ms latency threshold,
and ran one VM per host, assigning shares in a ![]() ratio.
ratio.
Table 7 reports the parameters and the overall
application performance for the two SQL Server VMs. Without PARDA,
both VMs have similar performance in terms of both orders per minute (OPM)
and average latency. When running with PARDA, the VM with higher
shares obtains roughly twice the OPM throughput and half the average
latency. The ratio isn't ![]() because the workloads are not always
backlogged, and the VM with higher shares can't keep its window
completely full.
because the workloads are not always
backlogged, and the VM with higher shares can't keep its window
completely full.
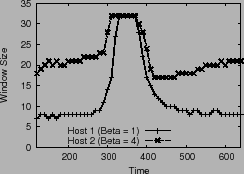
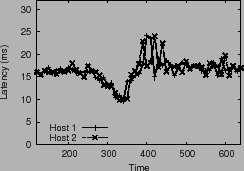
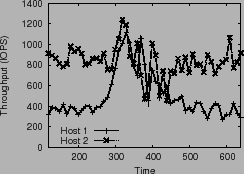
Figure 14 plots the window size, latency and throughput
observed by the hosts. As the overall latency decreases, PARDA is able
to assign high window sizes to both hosts. When latency increases, the
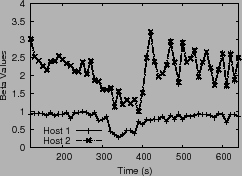
window sizes converge to be approximately proportional to the ![]() values. Figure 15 shows the
values. Figure 15 shows the ![]() values for the hosts
while the workload is running, and highlights the fact that the SQL
Server VM on host 2 cannot always maintain enough pending IOs to fill
its window. This causes the other VM on host 1 to pick up the slack
and benefit from increased IO throughput.
values for the hosts
while the workload is running, and highlights the fact that the SQL
Server VM on host 2 cannot always maintain enough pending IOs to fill
its window. This causes the other VM on host 1 to pick up the slack
and benefit from increased IO throughput.
|
 |
Ajay Gulati 2009-01-14