| port |
traffic feature |
distribution |
| 53 |
Requests per second |
Poisson(1.828) |
| Requests per host |
Paretto(1.1,2.17) |
| Request size |
Paretto(32.74,2.5) |
| Reply size |
Paretto(117.5,3.1) |
| 80 |
Requests per second |
Poisson(94.147) |
| Requests per host |
Paretto(10.2,0.315) |
| Request size |
Paretto(287,2.35) |
| Reply size |
Paretto(259,2.028) |
For DDoS experimentation, we are interested in modeling topologies of the target network and its Internet Service Provider. We will refer to these as end-network topology and AS-level topology.
AS-level topologies consist of router-level connectivity maps of selected Internet Service Providers. They are collected by the NetTopology tool, which we developed. The tool probes the topology data by invoking traceroute commands from different servers, performing alias resolution, and inferring several routing (e.g., Open Shortest Path First routing weights) and geographical properties. This tool is similar to
RocketFuel [14], and was developed because
RocketFuel is no longer supported.
We further developed tools to generate DETER-compatible input from the sampled topologies: (i) RocketFuel-to-ns, which
converts topologies generated by the NetTopology tool or
RocketFuel to DETER ns scripts, and (ii)
RouterConfig, a tool that takes a topology as input and
produces router BGP and OSPF configuration
scripts.
A major challenge in a testbed setting is the scale-down of a large, multi-thousand node topology to a few hundred nodes available on DETER [1], while retaining relevant topology characteristics. The RocketFuel-to-ns tool allows a user to select a subset of
a large topology, specifying a set of Autonomous Systems or performing a breadth-first traversal from a specified point, with specified degree
and number-of-nodes bounds.
The RouterConfig tool operates
both on (a) topologies based on real Internet data, and on (b)
topologies generated from the GT-ITM topology
generator [18]. To assign realistic link bandwidths in
our topologies, we use information about typical link speed
distribution published by the Annual Bandwidth Report [16].
Since many end-networks filter outgoing ICMP traffic, the NetTopology tool cannot collect
end-network topologies. To overcome this obstacle, we
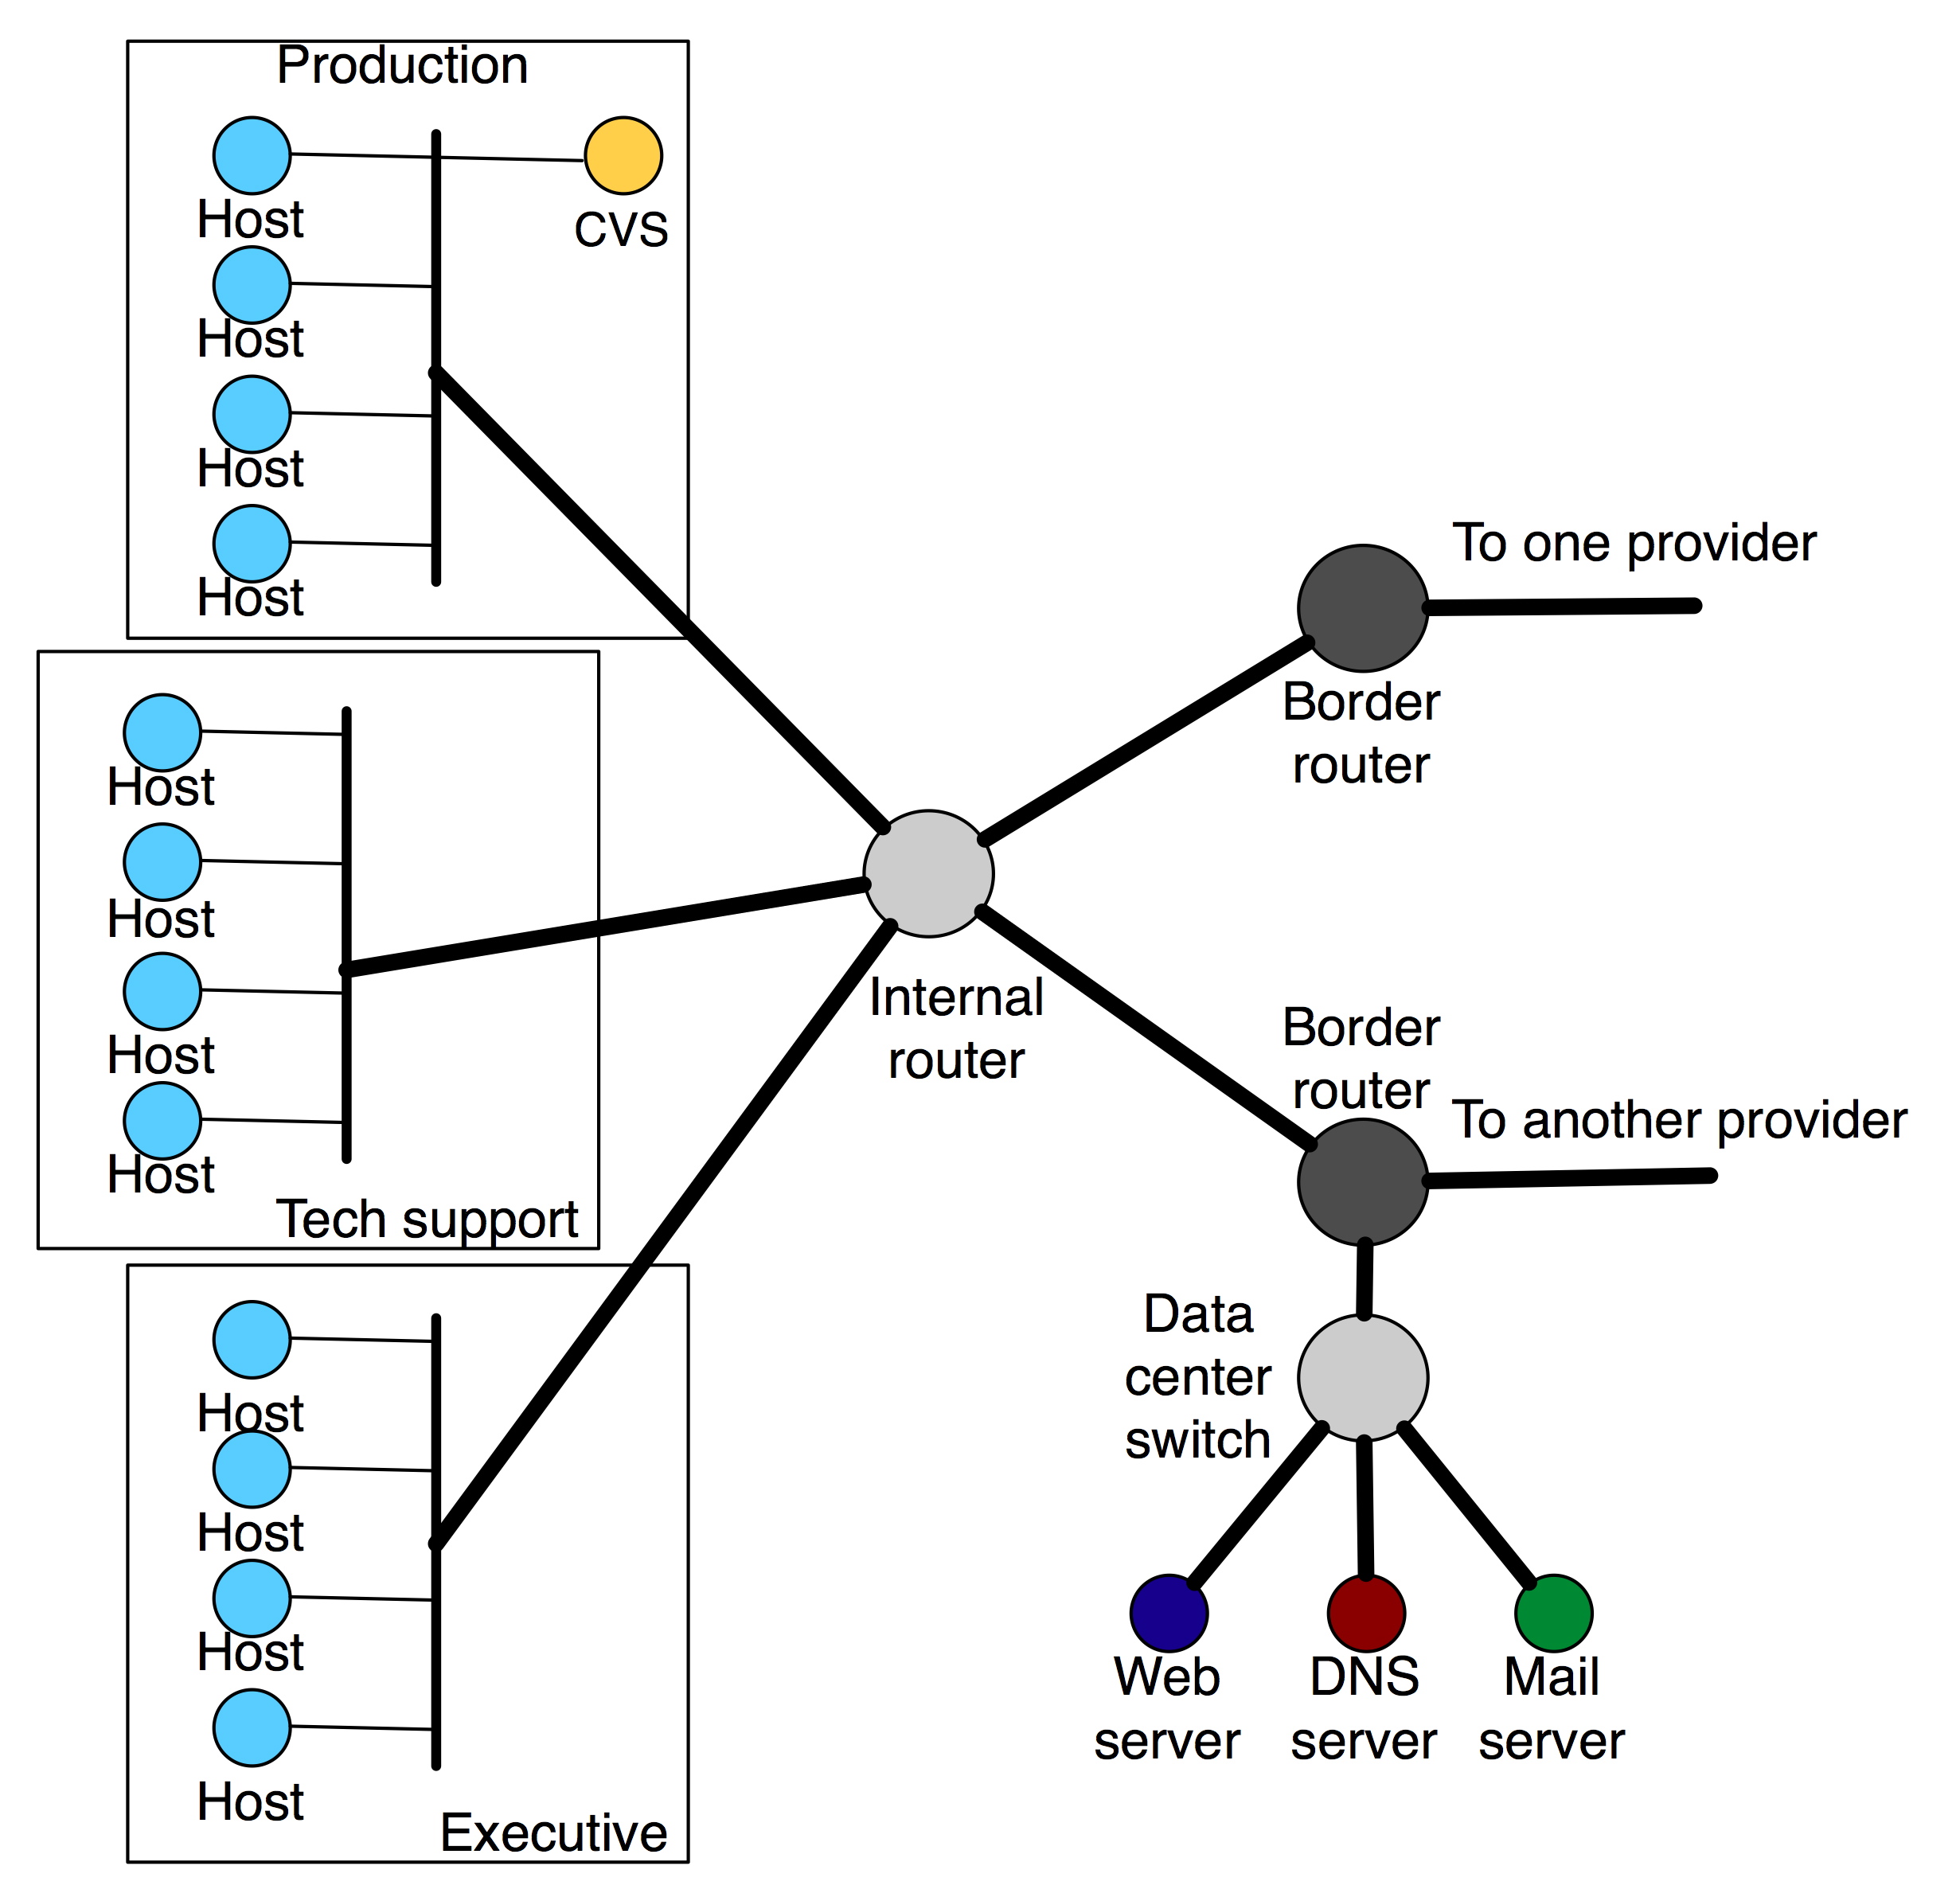
analyzed enterprise network design methodologies typically used in the commercial marketplace to design and deploy scalable, cost-efficient production networks. An example of this is Cisco's classic
three-layer model of hierarchical network design that is part of
Cisco's Enterprise Composite Network Model [7,17]. This consists of the topmost core layer which provides Internet access and ISP connectivity choices, and a middle distribution layer that connects the core to the access layer and serves to provide policy-based
connectivity to the campus. Finally, the bottom access layer
addresses the design of the intricate details of how individual
buildings, rooms and work groups are provided network access, and
typically involves the layout of switches and hubs. We used these design guidelines to produce end-network topologies with varying degrees of complexity and redundancy.
One such topology is shown in Figure 4.
To generate comprehensive attack scenarios we sought to understand which features of the attack interact with the legitimate traffic, the topology and the defense.
We first collected information about all the known DoS attacks and categorized them based on the mechanism they deploy to deny service. We then selected for further consideration only those DoS attacks that require distribution. These are packet floods and congestion control exploits.
Packet floods deny service by exhausting some key resource.
This resource could be bandwidth (if the
flood volume is large), router or end host CPU (if packet rate of the
flood is high) or tables in memory created by the
end host operating system or application (if each attack packet creates a new record in some table). Packets in bandwidth and CPU exhaustion floods can belong to any transport and application protocol, as long as they are numerous, and may contain legitimate transactions, e.g., flash crowd attacks. An attacker can use amplification effects such as reflector attacks to generate large-volume floods. Examples of memory exhaustion floods are TCP SYN floods and random fragment floods.
In congestion control exploits the attacker creates the impression at a sender that there is congestion on the path. If the sender employs a congestion control mechanism, it reduces its sending rate. One example of such attacks is the shrew attack with pulsing flood [4].
Table II lists all the attack types in the benchmark suite and their denial-of-service mechanisms. Although there are a few attack categories, they can invoke a large variety of DoS conditions and challenge defenses by varying attack features such as sending dynamics, spoofing and rates.
Figure 4:
A sample end-network topology
|
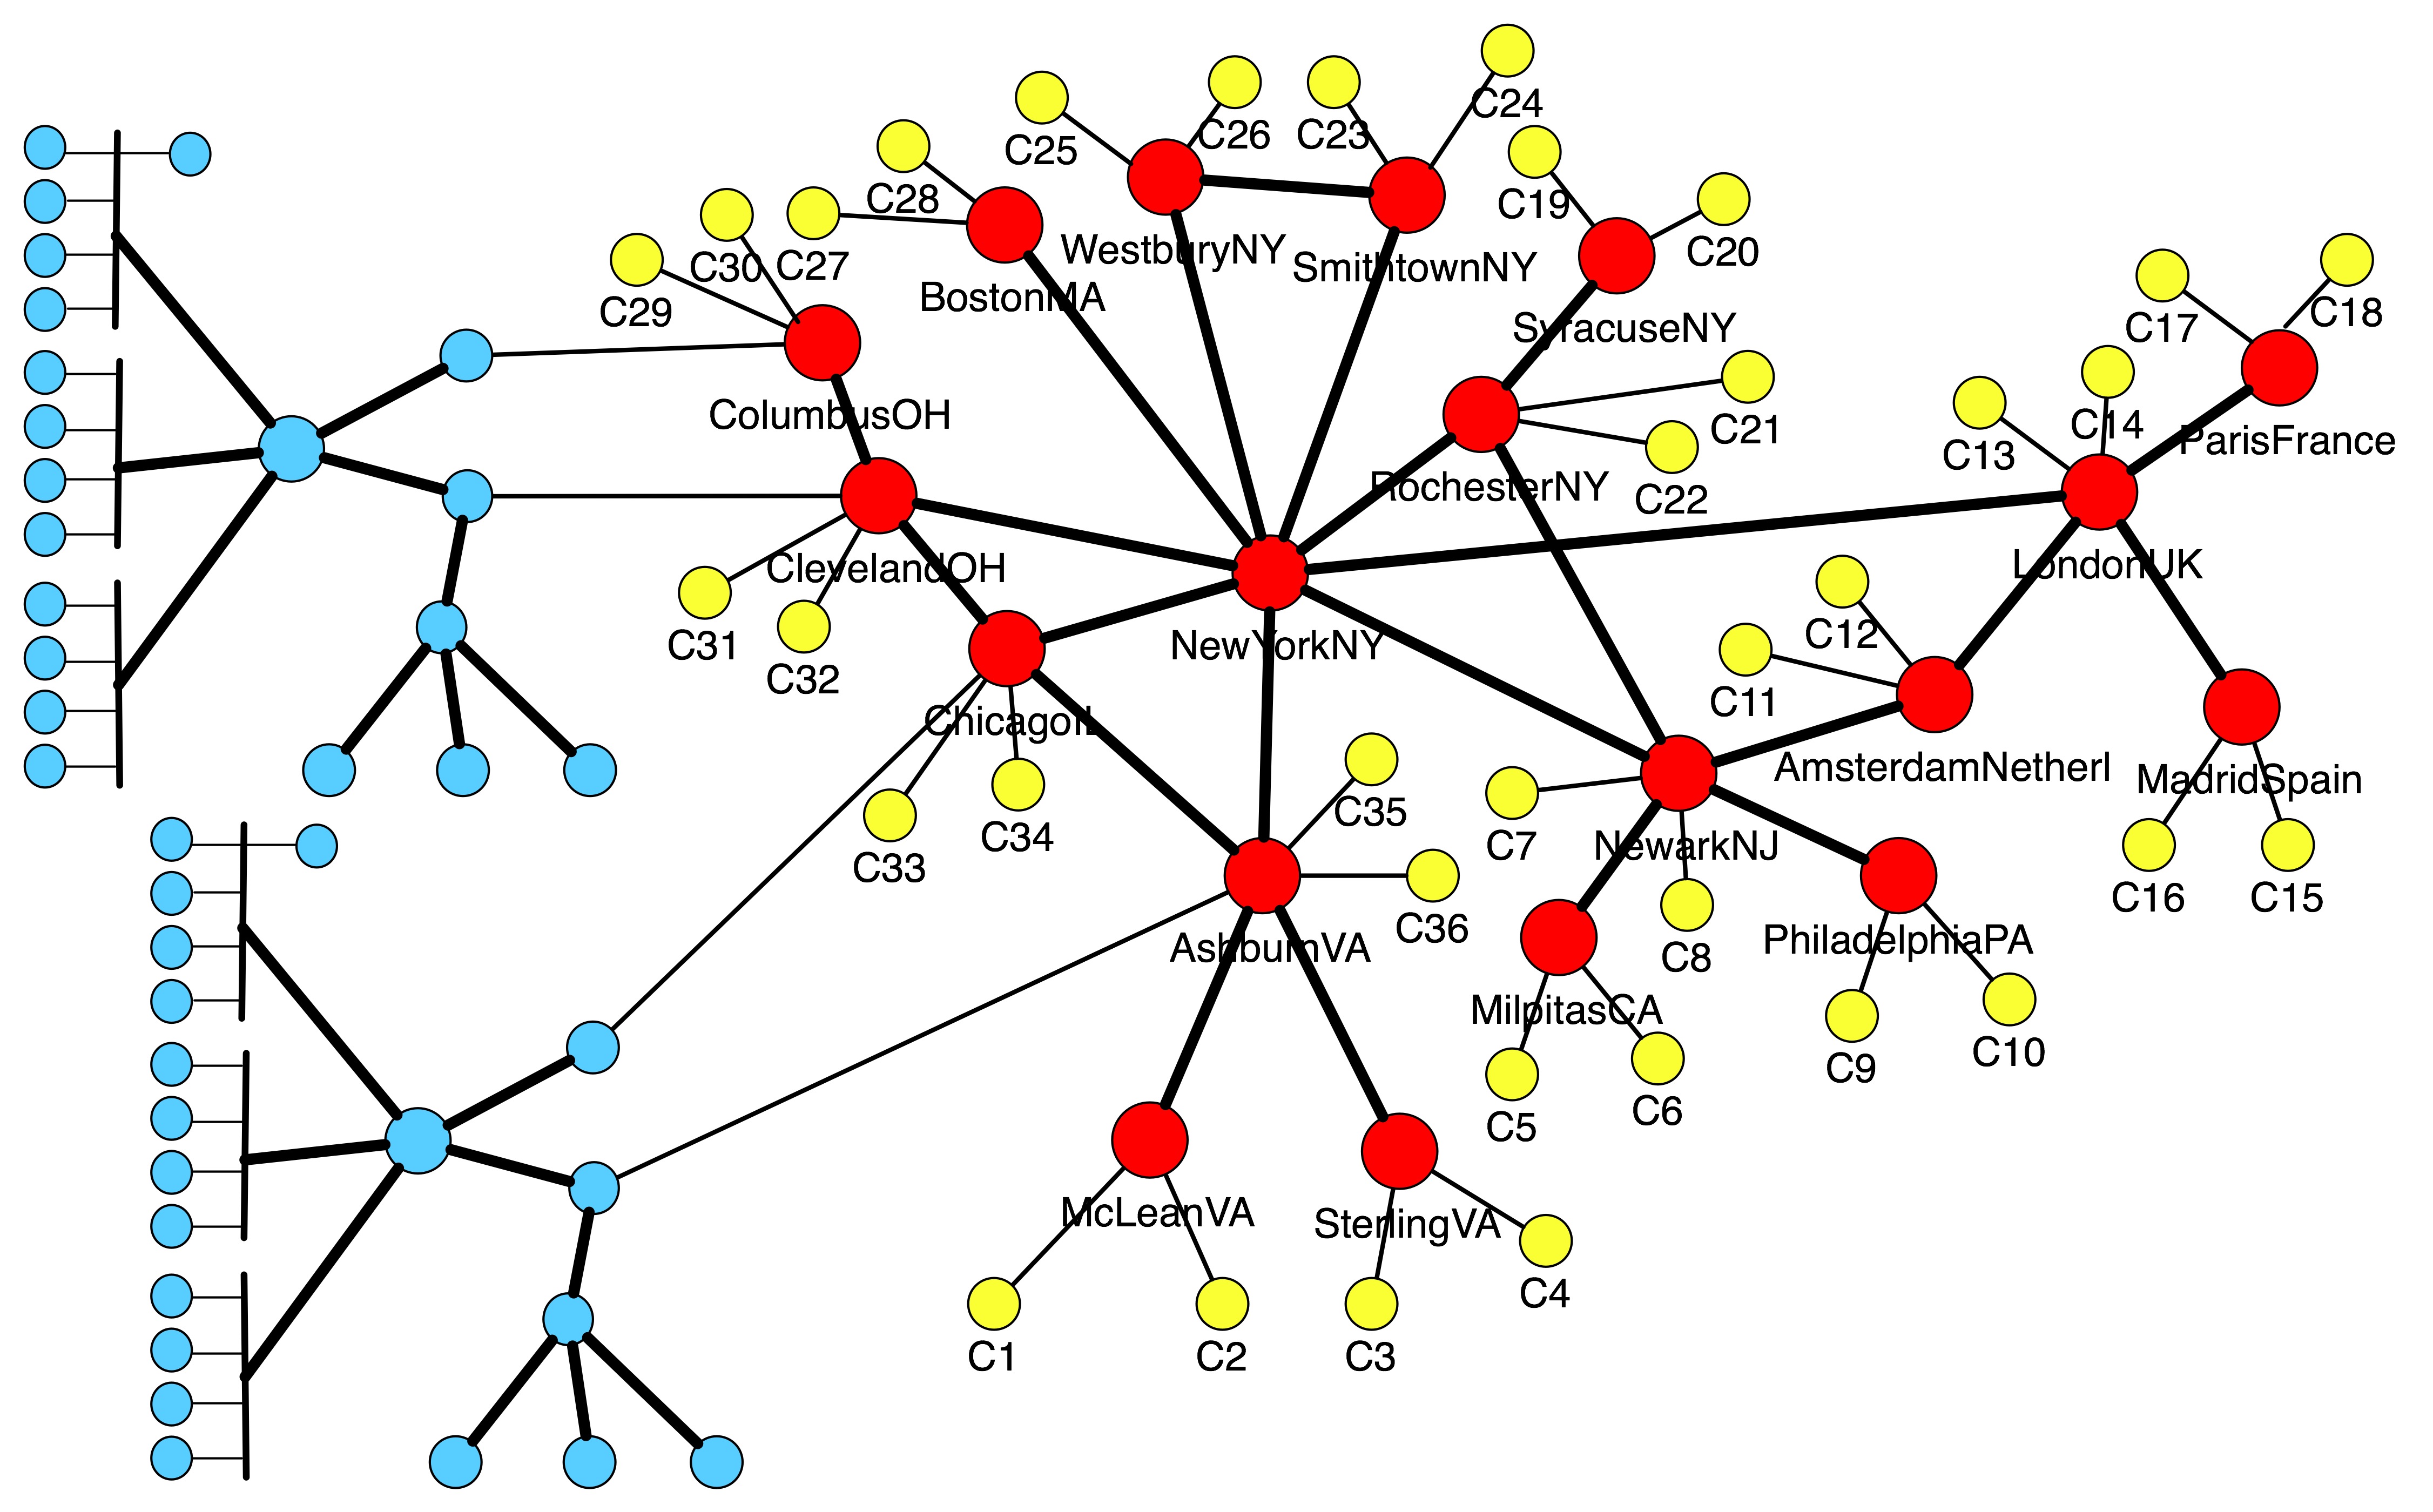
Figure 5:
Merging of the NTT America AS topology (red nodes)
with two copies of the edge network (blue nodes) and two clones per candidate AS-node (yellow nodes).
|
Table II:
Attack types in the comprehensive benchmark suite
| Attack type |
DoS mechanism |
| UDP/ICMP packet flood |
Large packets consume bandwidth, while small packets consume CPU |
| TCP SYN flood |
Consume end-host's connection table |
| TCP data packet flood |
Consume bandwidth or CPU |
| HTTP flood |
Consume Web server's CPU or bandwidth |
| DNS flood |
Consume DNS server's CPU or bandwidth |
| Random fragment flood |
Consume end-host's fragment table |
| TCP ECE flood |
Invoke congestion control |
| ICMP source quench flood |
Invoke congestion control |
|
Attack traffic generated by the listed attacks interacts with legitimate traffic by creating real or perceived contention at some critical resource. The level of service denial depends on the following traffic and topology features: (1) Attack rate, (2) Attack distribution, (3) Attack traffic on and off periods in case of pulsing attacks, (4) The rate of legitimate traffic relative to the attack, (5) Amount of critical resource -- size of connection buffers, fragment tables, link bandwidths, CPU speeds, (6)
Path sharing between the legitimate and the attack traffic prior to the critical resource, (7)
Legitimate traffic mix at the TCP level -- connection duration,
connection traffic volume and sending dynamics, protocol versions at end hosts, (8)
Legitimate traffic mix at the application level -- since different applications have
different quality of service requirements, they may or may not be affected by a certain level of
packet loss, delay or jitter.
If we assume that the legitimate traffic mix and topological features are fixed by inputs from our legitimate traffic models and topology samples, we must vary the attack rate, distribution, dynamics and path sharing to create comprehensive scenarios. Additionally, presence of IP spoofing can make attacks more challenging to some DDoS defenses.
Table III lists the feature variations included in our benchmark suite for each attack type listed in Table II.
Table III:
Attack feature variations that influence DoS impact
| Feature |
Variation |
| Rate |
Low, moderate and large |
| Attacker aggressiveness |
Low, moderate and large |
| Dynamics |
Continuous rate vs. pulsing (vary on and off periods)
Synchronous senders vs. interleaved senders |
| Path sharing |
Uniform vs. clustered locations of
attack machines; legitimate clients are distributed
uniformly |
| Spoofing |
None, subnet, fixed IP and random |
The benchmark suite contains a list of attack specifications that include: attack type (from table II), packet size (large or small), attacker deployment pattern (uniform or clustered), attack dynamics (flat rate, synchronous pulse and interleaved pulse), attack rate (low, moderate or large), attacker aggressiveness (whether the chosen attack rate is spread over a low, moderate or large number of attackers) and spoofing type. All combinations of attack features are explored, but those that are contradictory, e.g., spoofing with an application-level attack such as HTTP flood, are discarded.
The Experiment Generator receives as input (1) AS-level and edge-network topologies from the topology library, (2) legitimate traffic models generated by the LTProf tool, and (3) list of attacks. It glues these elements together into an ns file containing topology specification and a collection of Perl scripts, one for each attack from the list and one script for legitimate-traffic-only testing.
The AS-level and the edge-network topology are glued together by the TopologyMerge script in the following manner:
- We identify the nodes in the AS-level topology that have less than 9 neighbors, with 9 being the maximum number of network interfaces a node can have in DETER. Identified nodes become candidates for expansion.
- We identify border routers in the edge-network topology and connect each to one candidate AS node, via a limited-bandwidth link.
- One input parameter to our script is the desired number of edge networks in the final topology. This is relevant for experiments that test collaborative defenses and need several copies of the edge networks to deploy the defense at each copy. If the input number of copies is greater than 1 we create multiple copies of the edge network and repeat step (2) for each copy.
- Each candidate AS-node is further expanded by attaching to it several newly created nodes to play the role of the external subnet communicating with the attack's target, or the role of an attacker. We call these new nodes clones. The number of clones to be attached to each AS-node is given as an input parameter to our script.
- Each clone is assigned a /24 or /16 address range (an input parameter controls the size of the range) and routing is set accordingly.
We assign multiple addresses to clone nodes to generate sufficient source address diversity at the target -- this is an important feature for some DDoS defenses that model entropy of source IP addresses.
Figure 5 illustrates merging of the NTT America's AS topology
with two copies of the edge network shown in Figure 4 and with two clones per each candidate AS-node. The outcome of the merging is an ns file that can be used to create a new experiment on the DETER testbed, either manually or via the Workbench GUI.
We produce the Perl scripts for experimentation by feeding the topology file, the legitimate traffic and the attack traffic specifications into the CreateScenario script. The script identifies clone nodes in the topology and randomly chooses some to play the role of legitimate subnets. After parsing the legitimate traffic models, commands are generated to set up traffic generators at selected clone nodes. The remaining clone nodes are called free clones. For each attack description the script iterates through the following steps:
- Print the standard Perl script preamble and legitimate traffic setup commands to a new output file.
- Calculate attack rate in packets per second, taking into account the packet size. Small-packet attacks target CPU resources, while large-packet attacks target bandwidth. Since we know hardware capacities in DETER we can easily calculate the attack rate that exhausts CPU or bandwidth in our target topology.
- Calculate the maximum capacity of an individual attacker (in packets or bytes per second) and, by dividing attack rate with capacity, obtain the minimum number of attackers.
- For very aggressive attackers, the minimum number of attackers will be deployed. For non-aggressive attackers, all free clones become attack nodes. The number of attack nodes for moderately aggressive attackers lies in between these two cases, and is roughly one half of all free clones.
- Select clone nodes to act as attackers according to the attacker distribution. This option only makes sense for very and moderately aggressive attackers, since non-aggressive attackers use each free clone node. For the uniform distribution, attack locations are selected at random among free clones. At the same time, to maximize path sharing, the script ensures that each AS-node that has a legitimate clone also has an attacker clone. For the clustered distribution, the first attack node is deployed at random. The remaining nodes are deployed iteratively: (a) Assign a probability to each free clone to be selected, with higher probabilities given to clones in the neighborhood of attack nodes, and (b) Flip a coin for each free clone biased by its selection probability and deploy new attack nodes on clones favored by the coin flip.
- Generate attack setup commands for selected nodes, attack type, attack rate, attack dynamics and spoofing strategy.
- Generate commands for starting and stopping legitimate traffic generators, attack traffic generators and traffic statistics collection.
The result of the CreateScenario script is a set of Perl scripts that a user can run manually or via the Workbench's GUI. We are also working on automated batch testing where the Workbench will run multiple selected scripts and store results for later user's review.
For space reasons we provide a brief overview of work related to automated testing and benchmarking. In [11] Sommers et al. propose a framework for malicious workload generation called MACE.
MACE provides an extensible environment for construction of various
malicious traffic, such as intrusions, worms and DDoS attacks, but only a few attack generators are implemented. In DDoS realm, MACE only produces SYN flood and fragment flood attacks, with optional spoofing. Our generation tools provide a wider variety of attacks.
Similarly, Vigna et al. propose automatic generation of exploits in [15], for testing of intrusion detection systems. Our work focuses on DDoS attacks.
In [12], Sommers et al. propose a traffic generation method for
online Intrusion Detection System evaluation. This work relies solely on Harpoon for traffic generation, and contains a limited number of simple DoS attacks. We use a wider variety of traffic generators and attacks.
The Center for Internet Security has
developed benchmarks for evaluation of operating system security
[2], and large security bodies such as CERT and SANS maintain checklists of
known vulnerabilities that can be used by software developers to test
the security of their code. However, much remains
to be done to define rigorous and representative tests for
various security threats, and we tackle this problem for DDoS attacks.
Various approaches for handling DDoS attacks have been hard to study and compare because of lack of a common facility and experimental methodology. The DETER testbed provides the necessary facility, and the work described in this paper provides the methodology. We have built a complete set of tools that will allow even novices to quickly run standardized experiments on various DDoS situations. Since the tools are common, experiments run by different groups will be more directly comparable than they have been in the past.
Our automation mechanisms are based on realistic choices of topologies and legitimate traffic patterns. Our attack tools are highly parameterizable and are based on observations of properties of real DDoS attacks. We have included three open source
defense mechanisms for experimenters to work with, and plan to add more as they
become available in sufficiently stable form. Experimenters can easily
integrate their own defenses or new topologies and traffic generators into the Workbench, which is an open-source tool. We have provided both a full
graphical interface and a powerful scripting capability for creating
experiments that cover an extremely wide range of the possibilities.
The Workbench is currently being transformed into the Security Experimentation EnviRonment (SEER). It is currently available in the DETER testbed (at https://seer.isi.deterlab.net/), and is being extended to support experimentation with other threats such as worms, routing attacks etc. The Experiment Generator is also integrated with SEER and we are looking into extending it for other experiments, beyond DoS.
Our tools will significantly ease the difficult problem of performing
high quality experiments with DDoS attacks. They will be useful not only to researchers, but to students and educators who need to learn about denial of service. Our future work will focus on extending our collections of traffic generators, topologies, defenses and statistics collection tools, and on applying automation to experiments with other network security threats.
- 1
-
T. Benzel, R. Braden, D. Kim, C. Neuman, A. Joseph, K. Sklower, R. Ostrenga,
and S. Schwab.
Experiences With DETER: A Testbed for Security Research.
In 2nd IEEE TridentCom, March 2006.
- 2
-
The Center for Internet Security.
CIS Standards Web Page.
https://www.cisecurity.org/.
- 3
-
E. Kohler, R. Morris, B. Chen, J. Jannotti, and M. F. Kaashoek.
The Click modular router.
ACM Transactions on Computer Systems, 18(3):263-297, August
2000.
- 4
-
A. Kuzmanovic and E. W. Knightly.
Low-Rate TCP-Targeted Denial of Service Attacks (The Shrew vs. the
Mice and Elephants).
In ACM SIGCOMM 2003, August 2003.
- 5
-
J. Mirkovic.
D-WARD: source-end defense against distributed
denial-of-service attacks.
PhD thesis, UCLA, 2003.
- 6
-
J. Mirkovic, A. Hussain, B. Wilson, S. Fahmy, P. Reiher, R. Thomas, W. Yao, and
S. Schwab.
Towards User-Centric Metrics for Denial-Of-Service Measurement.
In Workshop on Experimental Computer Science, 2007.
- 7
-
P. Oppenheimer.
Top-Down Network Design.
CISCO Press, 1999.
- 8
-
C. Papadopoulos, R. Lindell, J. Mehringer, A. Hussain, and R. Govindan.
COSSACK: Coordinated Suppression of Simultaneous Attacks.
In Proceedings of DISCEX, pages 2-13, 2003.
- 9
-
EMIST project.
Evaluation methods for internet security technology.
https://www.isi.edu/deter/emist.temp.html.
- 10
-
J. Sommers, H. Kim, and P. Barford.
Harpoon: A Flow-Level Traffic Generator for Router and Network
Tests.
In ACM SIGMETRICS, 2004.
- 11
-
J. Sommers, V. Yegneswaran, and P. Barford.
A Framework for Malicious Workload Generation.
In ACM Internet Measurement Conference, 2004.
- 12
-
J. Sommers, V. Yegneswaran, and P. Barford.
Toward Comprehensive Traffic Generation for Online IDS Evaluation.
Technical report, Dept. of Computer Science, University of Wisconsin,
August 2005.
- 13
-
Sparta, Inc.
A Distributed Denial-of-Service Detection and Response System.
https://www.isso.sparta.com/research/documents/floodwatch.pdf.
- 14
-
N. Spring, R. Mahajan, and D. Wetherall.
Measuring ISP topologies with RocketFuel.
In Proceedings of ACM SIGCOMM, 2002.
- 15
-
G. Vigna, W. Robertson, and D. Balzarotti.
Testing Network-based Intrusion Detection Signatures Using Mutant
Exploits.
In ACM Conference on Computer and Communication Security, 2004.
- 16
-
Websiteoptimization.com.
The Bandwidth Report.
https://www.websiteoptimization.com/bw/.
- 17
-
R. White, A. Retana, and D. Slice.
Optimal Routing Design.
CISCO Press, 2005.
- 18
-
E. Zegura, K. Calvert, and S. Bhattacharjee.
How to Model an Internetwork.
In Proc. of IEEE INFOCOM, volume 2, pages 594 -602, March
1996.
Automating DDoS Experimentation
This document was generated using the
LaTeX2HTML translator Version 2002-2-1 (1.70)
Copyright © 1993, 1994, 1995, 1996,
Nikos Drakos,
Computer Based Learning Unit, University of Leeds.
Copyright © 1997, 1998, 1999,
Ross Moore,
Mathematics Department, Macquarie University, Sydney.
Footnotes
- ... work
![[*]](footnote.png)
- This material is based on research sponsored by
the Department of Homeland Security under contract number
FA8750-05-2-0197, and by the Space and Naval Warfare Systems Center, San Diego, under contract number N66001-07-C-2001.
The views and conclusions contained herein
are those of the authors only.
| |
![[*]](footnote.png) on automating DDoS experimentation via three toolkits: (1)
The Experimenter's Workbench,
which provides a set of
traffic generation tools, topology and defense libraries and a
graphical user interface for experiment specification, control and
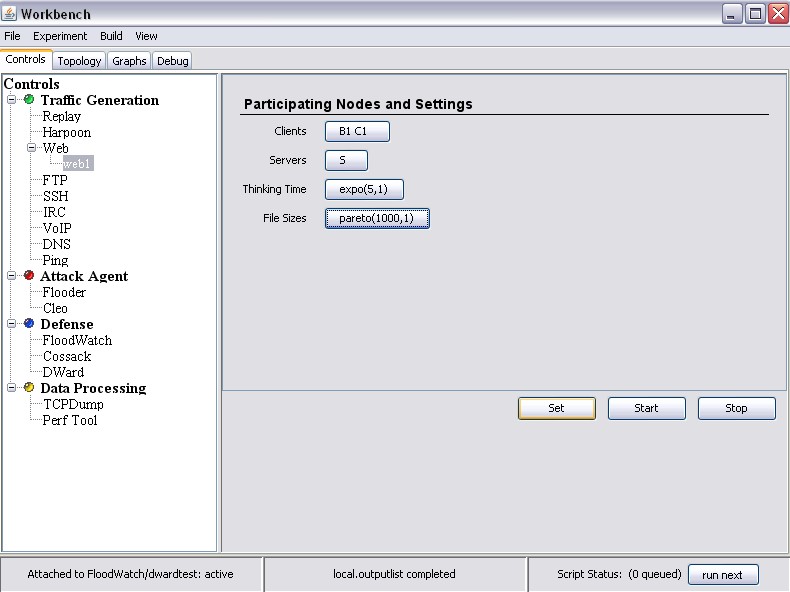
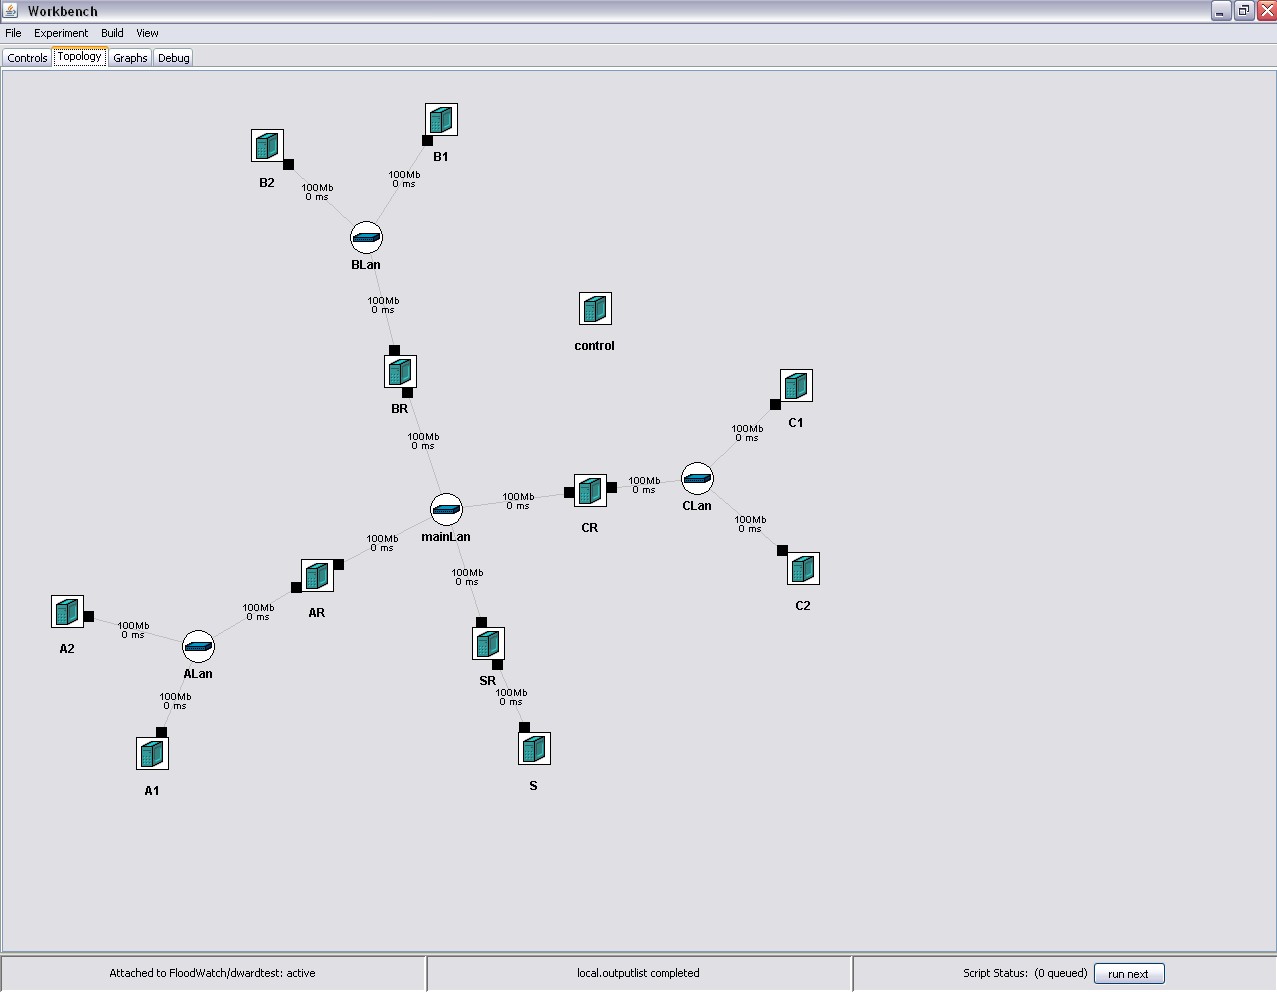
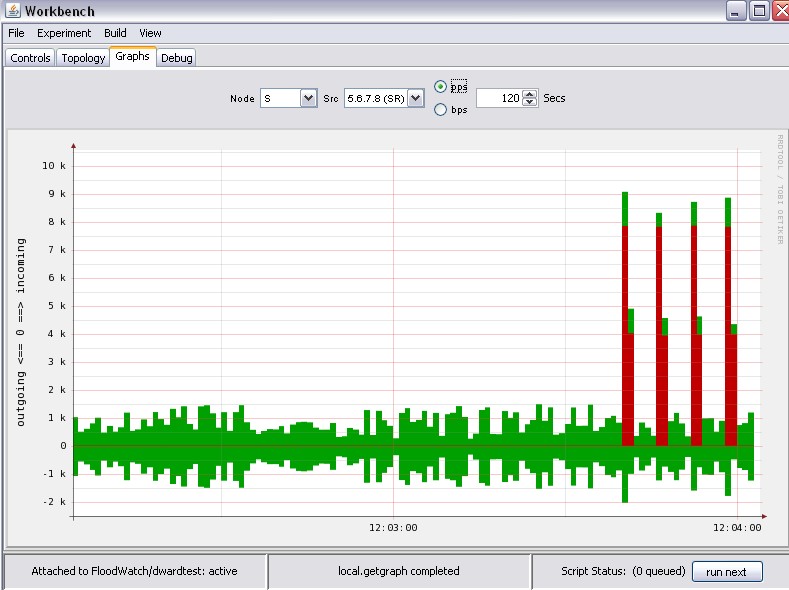
monitoring, (2) The DDoS benchmarks that provide a set of comprehensive topology, legitimate and attack traffic specifications, and (3) The Experiment Generator that receives an input either from a user via the Workbench's GUI or from the benchmark suite, and glues together a set of selected topologies, legitimate and attack traffic into a DETER-ready experiment. This experiment can be deployed and run from the Workbench at the click of a button.
Jointly, our tools facilitate easy DDoS experimentation even for novice users by providing a point-and-click interface for experiment control and a way to generate realistic experiments with minimal effort. Each component of an experiment, such as topological features, legitimate and attack traffic features, and performance measurement tools can also be customized by a user, facilitating full freedom for experimentation without the burden of low-level code writing and hardware manipulation.
on automating DDoS experimentation via three toolkits: (1)
The Experimenter's Workbench,
which provides a set of
traffic generation tools, topology and defense libraries and a
graphical user interface for experiment specification, control and
monitoring, (2) The DDoS benchmarks that provide a set of comprehensive topology, legitimate and attack traffic specifications, and (3) The Experiment Generator that receives an input either from a user via the Workbench's GUI or from the benchmark suite, and glues together a set of selected topologies, legitimate and attack traffic into a DETER-ready experiment. This experiment can be deployed and run from the Workbench at the click of a button.
Jointly, our tools facilitate easy DDoS experimentation even for novice users by providing a point-and-click interface for experiment control and a way to generate realistic experiments with minimal effort. Each component of an experiment, such as topological features, legitimate and attack traffic features, and performance measurement tools can also be customized by a user, facilitating full freedom for experimentation without the burden of low-level code writing and hardware manipulation.

