
In this section, we present two simple case studies to illustrate the benefits of EtE monitor in assessing web site performance. The first site is the HP Labs external site (HPL Site), https://www.hpl.hp.com. Static web pages comprise most of this site's content. We measured performance of this site for a month, from July 12, 2001 to August 11, 2001. The second site is a support site for a popular HP product family, which we call Support Site. It uses JavaServer Pages [11] technology for dynamic page generation. The architecture of this site is based on a geographically distributed web server cluster with Cisco Distributed Director [5] for load balancing, using ``sticky connections''. We measure the site performance for 2 weeks, from October 11, 2001 to October 25, 2001.
Table 4 summarizes the two site's performance at-a-glance during the measured period using the two most frequently
accessed pages at each site.
 |
Given the above summary, we now present more detailed information from our site measurements. For the HPL site, the two most popular pages during the observed period were index.html and a page in the news section describing the Itanium chip (we call it itanium.html).
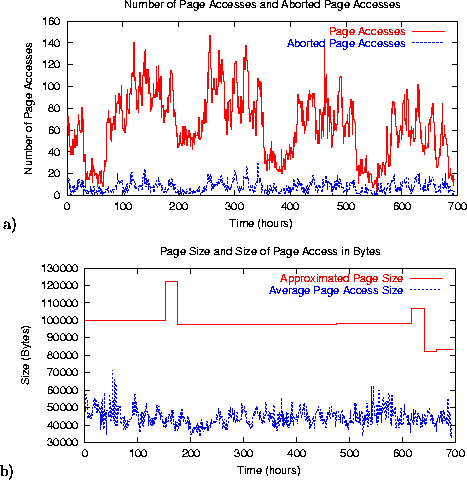
Figure 5 a) shows the number of page accesses to index.html, as well as the number of aborted page accesses during the measured period. The graph clearly reflects weekly access patterns to the site.
Figure 5 b) reflects the approximate page size, as reconstructed by EtE monitor. We use this
data to additionally validate the page reconstruction process. While
debugging the tool, we manually compare the content of the 20 most
frequently accessed pages reconstructed by EtE monitor against the
actual web pages: the EtE monitor page reconstruction accuracy for
popular pages is very high, practically
100%. Figure 5 b) allows us to ``see''
the results of this reconstruction process over the period of the
study. In the beginning, it is a straight line exactly coinciding
with the actual page size. At hour mark 153, it jumps and returns to a
next straight line interval at the 175 hour mark. As we verified, the
page has been partially modified during this time interval. The EtE
monitor ``picked'' both the old and the modified page images, since
they both occurred during the same day interval and represented a
significant fraction of accesses. However, the next day, the Knowledge Base was ``renewed'' and had only the modified page
information. The second ``jump'' of this line corresponds to the next
modification of the page. The gap can be tightened, depending on the
time interval EtE monitor is set to process. The other line in
Figure 5 b) shows the average page
access size, reflecting the server byte hit ratio of approximately
44%.
 |
 |
To characterize the reasons leading to the aborted web pages, we
present analysis of the aborted accesses to index.html page for
3 days in August (since the monthly graph looks very ``busy'' on an
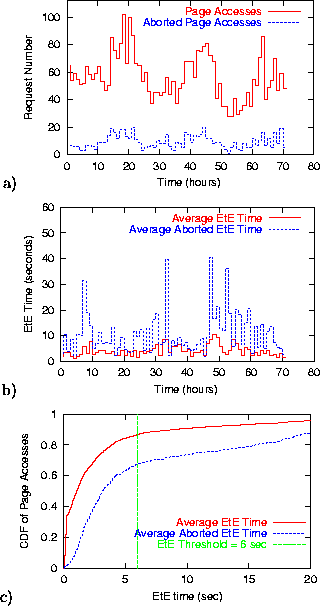
hourly scale). Figure 7 a) shows
the number of all the requests and the aborted requests to index.html page during this interval. The number of aborted accesses
(662) accounts for ![]() of the total number of requests
(4028).
of the total number of requests
(4028).
 |
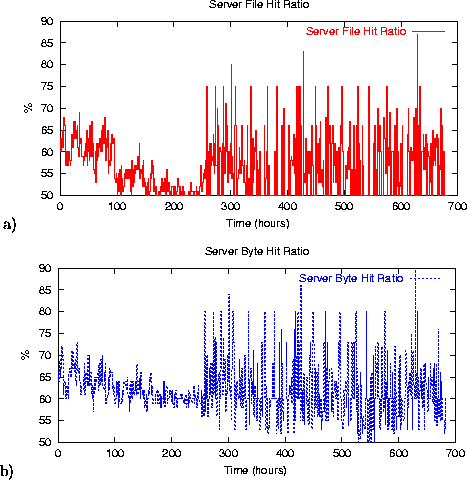 |
Figure 7 b) shows the average end-to-end response time measured by EtE monitor for index.html and the average end-to-end response time for the aborted accesses to index.html on an hourly scale. The end-to-end response time for index.html page, averaged across all the page accesses, is 3.978 sec, while the average end-to-end response time of the aborted page accesses is 9.21 sec.
Figure 7 c) shows a cumulative distribution of all accesses and aborted accesses to index.html sorted by the end-to-end response time in increasing order. The vertical line on the graph shows the threshold of 6 sec that corresponds to an acceptable end-to-end response time. Figure 7 c) shows that 68% of the aborted accesses demonstrate end-to-end response times below 6 sec. This means that only 32% of all the aborted accesses, which in turn account for 5% of all accesses to the page, observe high end-to-end response time. The next step is to distinguish the reasons leading to a poor response time: whether it is due to network or server performance problems, or both. For all the aborted pages with high response time, the network portion of the response time dominates the overall response time (98%-99% of the total). Thus, we can conclude that any performance problems are likely not server-related but rather due to congestion in the network (though it is unclear whether the congestion is at the edge or the core of the network).
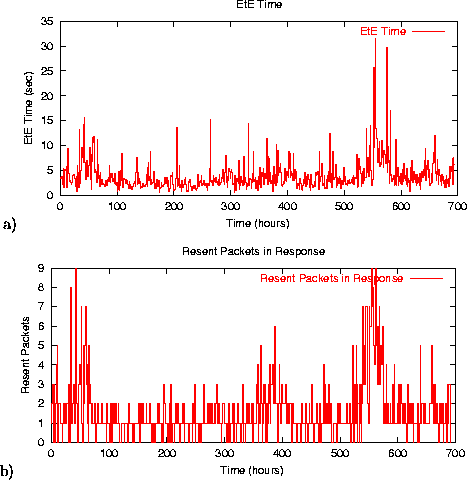
Figure 7 a) shows the end-to-end response time for accesses to index.html on an hourly scale during a month. In spite of good average response time reported in at-a-glance table, hourly averages reflect significant variation in response times. This graph helps to stress the advantages of EtE monitor and reflects the shortcomings of active probing techniques that measure page performance only a few times per hour: the collected test numbers could vary significantly from a site's instantaneous performance characteristics.
Figure 7 b) shows the number of resent packets in the response stream to clients. There are three pronounced ``humps'' with an increased number of resent packets. Typically, resent packets reflect network congestion or the existence of some network-related bottlenecks. Interestingly enough, such periods correspond to weekends when the overall traffic is one order of magnitude lower than weekdays (as reflected in Figure 5 a)). The explanation for this phenomenon is that during weekends the client population of the site ``changes'' significantly: most of the clients access the site from home using modems or other low-bandwidth connections. This leads to a higher observed end-to-end response time and an increase in the number of resent packets (i.e., TCP is likely to cause drops more often when probing for the appropriate congestion window over a low-bandwidth link). These results again stress the unique capabilities of EtE monitor to extract appropriate information from network packets, and reflect another shortcoming of active probing techniques that use a fixed number of artificial clients with rather good network connections to the Internet. For site designers, it is important to understand the actual client population and their end-to-end response time and the ``quality'' of the response. For instance, when large population of clients have limited bandwidth parameters, the site designers should consider making the pages and their objects ``lighter weight''.
 |
 |
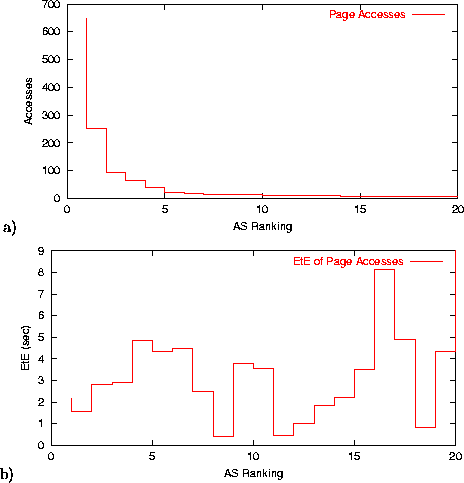 |
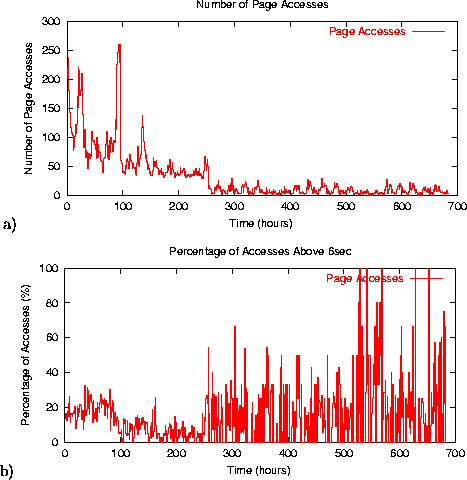
Figure 8 a) shows the number of page accesses to itanium.html. When we started our measurement of the HPL site, the itanium.html page was the most popular page, ``beating'' the popularity of the main index.html page. However, ten days later, this news article started to get ``colder'', and the page got to the seventh place by popularity.
Figure 8 b) shows the percentage of accesses with end-to-end response time above 6 sec. The percentage of high response time jumps significantly when the page becomes ``colder''. The reason behind this phenomenon is shown in Figure 9, which plots the server file hit and byte hit ratio. When the page became less popular, the number of objects and the corresponding bytes retrieved from the server increased significantly. This reflects that fewer network caches store the objects as the page becomes less popular, forcing clients to retrieve them from the origin server.
Figure 8 b) and Figure 9 explicitly demonstrate the network caching impact on end-to-end response time. When the caching efficiency of a page is higher (i.e., more page objects are cached by network and browser caches), the response time measured by EtE monitor is lower. Again, active probing techniques cannot measure (or account for) the page caching efficiency to reflect the ``true'' end-to-end response time observed by the actual clients.
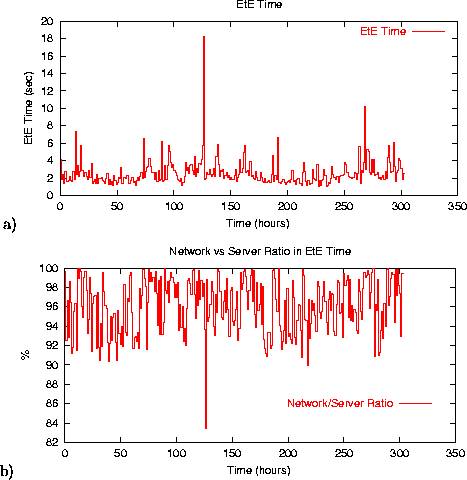
We now switch to the analysis of the Support site. We will only highlight some new observations specific to this site. Figure 10 a) shows the average end-to-end response time as measured by EtE monitor when downloading the site main page. This site uses JavaServer Pages technology for dynamic generation of the content. Since dynamic pages are typically more ``compute intensive,'' it has a corresponding reflection in higher server-side processing fraction in overall response time. Figure 10 b) shows the network-server time ratio in the overall response time. It is higher compared to the network-server ratio for static pages from the HPL site. One interesting detail is that the response time spike around the 127 hour mark has a corresponding spike in increased server processing time, indicating some server-side problems at this point. The combination of data provided by EtE monitor can help service providers to better understand site-related performance problems.
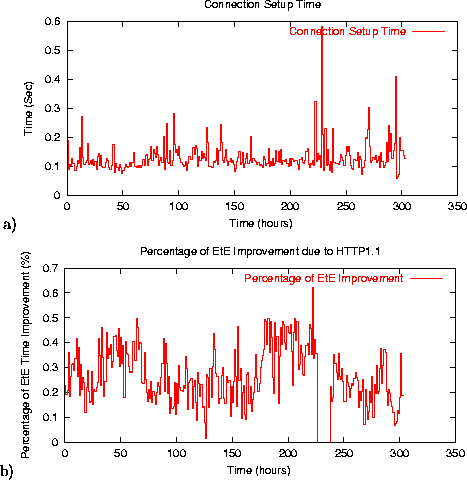
The Support site pages are composed of a large number of embedded images. Two most popular site pages, which account for almost 50% of all the page accesses, consist of 32 objects. The caching efficiency for the site is very high: only 8-9 objects are typically retrieved from the server, while the other objects are served from network and browser caches. The site server is running HTTP 1.0 server. Thus typical clients used 7-9 connections to retrieve 8-9 objects. The ConcurrencyCoef (see Section 6), which reflects the overlap portion of the latency between different connections for this page, was very low, around 1.038 (in fact, this is true for the site pages in general). This indicates that the efficiency of most of these connections is almost equal to sequential retrievals through a single persistent connection.
Figure 11 a) shows the connection setup time measured by EtE monitor. We perform a simple computation: how much of the end-to-end response time observed by current clients can be improved if the site server would run an HTTP 1.1 server, allowing clients to use just two persistent connections to retrieve the corresponding objects from the site? In other words, how much of the response time can be improved by eliminating unnecessary connection setup time?
Figure 11 b) shows the estimated percentage of end-to-end response time improvement available from running an HTTP 1.1 server. On average, during the observed interval, the response time improvement for url1 is around 20% (2.6 sec is decreased to 2.1 sec), and for url2 is around 32% (3.3 sec is decreased to 2.2 sec).
Figure 11 b) reveals an unexpected ``gap'' between 230-240 hour marks, when there was ``no improvement'' due to HTTP 1.1. More careful analysis shows that during this period, all the accesses retrieved only a basic HTML page using 1 connection, without consequent image retrievals. The other pages during the same interval have a similar pattern. It looks like the image directory was not accessible on the server. Thus, EtE monitor, by exposing the abnormal access patterns, can help service providers get additional insight into service related problems.
EtE monitor also provides the information about the client clustering by associating them with various ASes (Autonomous Systems). Figure 12 a) shows the 20 largest client clusters by ASes. Figure 12 b) reflects the corresponding average end-to-end response time per AS. The information provides a useful quantitative view on response times to the major client clusters. It can be used for efficient site design when the geographically distributed web cluster is needed to improve site performance. Similarly, such information can be used to make appropriate decisions on specific content distribution networks and wide-area replication strategies given a particular service's client population.
The ability of EtE monitor to reflect a site performance for different ASes (and groups of IP addresses) happens to be a very attractive feature for service providers. When service providers have special SLA-contracts with certain groups of customers, EtE monitor provides a unique ability to measure the response time observed by those clients and validate QoS for those contracts.
Finally, we present a few performance numbers to reflect the execution time of EtE monitor when processing data for the HPL and Support sites. The tests are run on a 550Mhz HP C3600 workstation with 512 MB of RAM. Table 5 presents the amount of data and the execution time for processing 10,000,000 TCP Packets.
|
The performance of reconstruction module performance depends on the complexity of the web page composition. For example, the Support site has a much higher percentage of embedded objects per page than the HPLabs pages. This ``higher complexity'' of the reconstruction process is reflected by the higher EtE monitor processing time for the Support site (17 min 41 sec) compared to the processing time for the HPLabs site (12 min 44 sec). The amount of incoming and outgoing packets of a web server farm that an EtE monitor can handle also depends on the rate at which tcpdump can capture packets and the traffic of the web site.