|
MobiSys '03 Paper
[MobiSys '03 Tech Program Index]
| Pp. 1-14 of the Proceedings |  |
Single Reflection Spatial Voting: A Novel Method for Discovering
Reflective Surfaces
Using Indoor Positioning Systems
R. K. Harle
Laboratory for Communication
Engineering, University of
Cambridge, UK
rkh23@cam.ac.uk
A. Ward
Ubiquitous Systems Limited
andy.ward@ubiquitous-systems.com
A. Hopper
Laboratory for Communication
Engineering, University of
Cambridge, UK
hopper@eng.cam.ac.uk
We present a novel method of using reflected pulses in indoor ultrasonic
positioning systems to infer the details of reflective objects in
the environment. The method is termed Single Reflection Spatial Voting
(SRSV), and we perceive its major use to be in the field of pervasive
computing, where automated object and surface discovery is emerging
as an important feature.
We demonstrate use of the method in the case of searching for vertical
walls using an existing ultrasonic position sensor system (the Bat
system). We find that valuable information can be extracted from reflection
data using SRSV, and are able to construct a model of the room using
a simple algorithm. We conclude that this method can be used to extract
base data upon which to build hypotheses about the environment, given
further sensor analysis.
We also briefly address the potential uses of SRSV in Ultra-Wideband
positioning, autonomous navigation, and map building.
Much of the current research in location systems concentrates on creating
an accurate and reliable indoor positioning system, the perceived
use of which is as a major component of a pervasive, context-aware
computing system. Indoor positioning systems typically rely on the
propagation of a physical wave phenomenon, such as ultrasonic or radio
waves. The prevalence of reflecting surfaces in indoor environments
drastically reduces the accuracy and reliability of positions returned
from such systems. We present a method to turn this apparent weakness
into a potential strength. We use reflected signals to help automate
the process of modelling the environment within which the sensor network
is operating.
Our experiences with a context-aware system [1] tell
us that useful and reliable applications stem from having both an
accurate position for an object or person, and from knowing
details about the environment within which they are positioned. Presently, such
environmental information is painstakingly entered by hand (for example,
wall vertices, table positions, workstation locations) to allow a
meaningful virtual model of the world to be formed (see
Figure 1).
Once a useful model is established, it must also cope with the
inherent dynamic nature of human environments. The applicability of a
model diminishes rapidly as it loses synchronisation with the world.
To remain useful, context-aware systems must be able to adapt to
changing environments. Our experiences suggest that such adaptation can only stem from the coordination of
sensor systems and processing methods. In this paper, we present a
powerful method based on the principle that important environment
information is superimposed on the positioning signals, in particular
the reflections.
 |
Figure 1:
A screen shot from a real-time environment
monitoring application in daily use.
Given details of reflecting surfaces, we can develop better
models of the world, allow for dynamic reconfiguration of the environment,
and potentially provide feedback into a positioning system to improve
accuracy. We stress that, whilst we present
much of the paper in the context of an ultrasonic positioning system
(the Bat system), the general method has potential uses outside of
ultrasonic systems.
The essential requirement of the method is that the positioning
medium interacts with objects within
the environment, giving rise to reflected signals. Standard media
used in positioning systems to date (ultrasound
[16,12,14], radio [2,3]) all
suffer from environmental reflections, and this has traditionally
been a large source of error. In addition, technologies expected to
offer ubiquitous positioning in the future, such as Ultra
Wideband radio, are susceptible to reflections.
The Bat system is a real-time positioning system for people and objects
in an indoor environment [16]. The system has previously
been implemented as a major component of a context-aware, pervasive
computing system [1]. One installation of the Bat system
covers the upper floor of the Laboratory for Communication Engineering,
encompassing an area of approximately 550m , and provides
a true context-aware computing environment in daily use. , and provides
a true context-aware computing environment in daily use.
As described in [1], the Bat system is based around
wireless active tags (``Bats'') worn by users or attached to objects.
A radio signal from a central controller triggers each Bat in turn,
at a known time. When triggered, each Bat emits an ultrasonic pulse,
which is received by a matrix of receivers placed at accurately known
locations in the ceiling. By measuring the time delays between emission
and reception of pulses, we gain estimates of the distance travelled
by the pulse to each receiver within range. We then use a multilateration
algorithm to convert the distance measurements to a location for the
Bat in three-dimensional space [10].
The Bat system operates in indoor office-like environments, which
contain many objects and surfaces that specularly reflect ultrasound
(such as computer monitors and walls). The pulse emitted by a Bat may travel
directly to a receiver (a direct-path signal), but may also arrive
after a reflection from one or more objects or surfaces in the
environment (a multipathed signal). Multipathed signals do not provide
information about the true (direct-path) distance of the Bat from
the receiver, and hence it is important to identify and eliminate
them from further processing.
 |
| (a) Three obstructions give rise to a direct-path
signal peak (1) and three multipathed peaks (2,3,4) in the power profile of the
received signal |
 |
| (b) A further obstruction hinders the direct-path
signal |
Figure 2:
Illustration of multipathed signal propagation between a receiver,r, and transmitter,t.
In situations where a direct-path signal reaches a receiver, the Bat
system can be sure that any subsequent pulse arrivals correspond to
multipathed signals, because any reflected paths must necessarily be longer than
the direct-path (Figure 2(a)). However, it is not always the case that the direct-path signal reaches the receiver, and in these situations the first
signal to arrive at the receiver will, in fact, be a multipathed
signal (Figure 2(b)).
The positioning algorithm used in the Bat system is therefore designed
to identify and reject multipathed signals, and we present here a simplified
overview of that algorithm and the heuristics it uses (further details are available in [16]).
Following the emission of a pulse by a Bat, and its subsequent reception,
we have a series of time-of-flight measurements. We convert these
time measurements to distances using the well-documented temperature
variation of the speed of sound [6]. We wish to derive four
quantities from this information; the components of the Bat location
( , , , , ), and an estimate of the positioning standard error.
To do so, then, we require a minimum of four (non-multipathed) readings. ), and an estimate of the positioning standard error.
To do so, then, we require a minimum of four (non-multipathed) readings.
The process of identifying and excluding multipathed signals begins
by forming a nonlinear model [13] of all the data,
providing an estimate of the four quantities we are interested in.
The error estimate is used to evaluate the model fit. If it exceeds
the known accuracy of the system (approximately 3cm), we evaluate
the residuals for each distance measure and order them numerically.
Traditional nonlinear model algorithms order the magnitude of these
residuals and discard the data associated with the largest and reprocess,
thereby removing the outliers and improving the result. We use a different
approach to capture the physical principle that no signal may arrive
at a receiver early (corresponding to movement faster than the speed
of sound), but only late (corresponding to a multipathed measure).
If we define  as the measured distance from a Bat to
a particular receiver, as the measured distance from a Bat to
a particular receiver,  as the distance calculated by
the model for the same quantity, then we can define the residual, as the distance calculated by
the model for the same quantity, then we can define the residual,
 , as being directly proportional to , as being directly proportional to
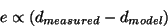 |
(1) |
If we assume that the model has converged spatially close to the correct position,
this quantity is negative when the model requires the signal to exceed
the speed of sound, and positive when the signal appears to be multipathed
(relative to the model predictions). We can adopt this as a general
heuristic, since it fails only in the unlikely case of the majority of received
signals being multipathed due to a specular object, causing the model
to converge on a reflection image.
Since the speed of sound is fixed,
but multipathed signals are likely, we maintain the sign of the residual,
and discard the largest positive residual as multipathed. We repeat
the process of modelling and discarding the measurement associated
with the largest positive residual until we reach the required accuracy
level, or until there are less than four measures remaining (a failure).
Consequently, when we return a position, we have classified the initial
distance measures into two groups; consistent with the position (assumed
non-multipathed), and inconsistent (assumed multipathed).
The Bat system receivers are also capable of recording the time-of-arrival
of any second pulse they receive (which corresponds, as described
earlier, to a multipathed signal). With each position, then, we can
identify multipathed signals by:
- Rejection from the positioning algorithm as described above.
- Reception of a second pulse at a receiver that returned a first pulse
consistent with the position calculated.
Whereas the Bat system rejects this reflection information as being
of no use in computing location information, we now turn our attention
to a method of using this data to derive information about the environment.
Barshan has described a spatial voting scheme for determining two
dimensional surface profiles using ultrasonic rangefinders mounted on a mobile
robot [5,4]. The method associates a circular
arc centred on the known position of the ultrasonic transceiver for each range measure,
with a radius equal to half the distance covered by the ultrasonic
pulse. By collecting a series of results from sufficiently different
transceiver positions (generated by a number of rangefinders on the
robot and/or by moving the robot platform), we expect to observe the highest density of arc
intersections along the locus of the surface, as illustrated in Figure
3. Spatial voting splits
the two dimensional plane into a regular grid of cells. With each
cell, we associate a number representing the number of arcs which
intersect its bounds. We can then extract a representation of the
surface, quantised to the cell size, by searching the grid for high
densities of intersections.
 |
Figure 3:
An illustration of the two dimensional
surface extraction based on rangefinders (shown as black circles). The
grey area represents the surface of interest, and the arc of each
circle segment corresponds to the range reading from a specific rangefinder.
We present here a novel and significant extension to Barshan's method which uses a
three dimensional Single Reflection Spatial Voting (SRSV) grid.
This approach differs from that of Barshan, since we use a
physically distinct ultrasonic transmitter and receiver, an
infrastructure that is in place and static, and a series of only multipathed
measurements.
SRSV is particularly suited
to the pervasive computing environment because it allows incremental
updating as more reflections are captured, but does not require that
the details for each reflection be individually stored, thereby reducing storage
requirements.
We make the assumption that multipathed pulses have reflected only
once; we have demonstrated that the method is sufficiently robust
that multiple reflections do not render the method invalid in practice.
In three dimensions, with a separate receiver and transmitter, the
two dimensional circular arcs described by Barshan become prolate spheroids with foci at each
of the receiver and transmitter locations, and the SRSV grid segments
the volume into regular cubes (``cells''). Analysis of the density
of spheroid intersections in each cell provides data about the environment,
such as the locations of walls and specular objects.
 |
Figure 4:
The reflection geometry for a single reflection
from a point  between a transmitter at between a transmitter at  and a receiver at
  , with a multipathed length of , with a multipathed length of  .
The thick outline (right) shows the associated prolate spheroid, and
the thin outline shows the elliptical locus of if we
assert that it is on a vertical wall. .
The thick outline (right) shows the associated prolate spheroid, and
the thin outline shows the elliptical locus of if we
assert that it is on a vertical wall.
Consider two points in three dimensional space representing a transmitter,
, and a receiver, , and a signal that propagates
between them via a single specular reflection from a point on a surface,
. If the distance travelled by the signal is known (through
time-of-flight measurement for example), the allowed locus of the
reflection point is a prolate spheroid with major axis  and minor
axis and minor
axis  (the shape formed by rotation of a two dimensional ellipse
about its major axis), as shown in thick outline in Figure 4.
Such a surface can be described in its principal co-ordinate frame
(marked (the shape formed by rotation of a two dimensional ellipse
about its major axis), as shown in thick outline in Figure 4.
Such a surface can be described in its principal co-ordinate frame
(marked  in Figure 4)
by the matrix formulation, in Figure 4)
by the matrix formulation,
 |
(2) |
where  represents a general three dimensional vector
in , and the matrix represents a general three dimensional vector
in , and the matrix  has components, has components,
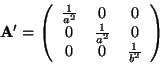 |
(3) |
where and are are the major and minor axes as shown in Figure
4. We derive these quantities from the path length
travelled by the reflected pulse,  , as defined in Figure 4.
Using simple geometrical arguments, we find: , as defined in Figure 4.
Using simple geometrical arguments, we find:
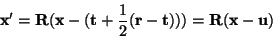
To describe this in co-ordinate frame  , our `real world' frame,
we apply a translation to make the origins coincident, and use Rodrigues'
rotation formula [11] to calculate the relevant rotation
matrix, , our `real world' frame,
we apply a translation to make the origins coincident, and use Rodrigues'
rotation formula [11] to calculate the relevant rotation
matrix,  , such that , such that
 |
(5) |
By transforming a regular three dimensional grid in system to
we can use geometry to calculate the intersection of this prolate
spheroid with the cells, forming an SRSV grid for arbitrary surfaces.
However, in pervasive systems we are usually able to restrict our
interest to a subset of surfaces such as vertical walls, near-vertical
screens, horizontal tables, etc. Such restrictions allow refinement
of the method. As an example, in this paper we will be primarily interested
in vertical surfaces, for which we wish to restrict the locus of
to spheroid points with a normal lying in the horizontal plane
of . To see this, consider the function,
 |
(6) |
which represents the path length for to  to . The quantity
 will point
in the direction of the sum of the unit vectors of will point
in the direction of the sum of the unit vectors of
 and
and
 , which bisects the angle between these
two vectors. Thus,
points in the direction
of the normal to the reflecting surface for a specular reflection
from to . The spheroid is defined by the
relation , which bisects the angle between these
two vectors. Thus,
points in the direction
of the normal to the reflecting surface for a specular reflection
from to . The spheroid is defined by the
relation
 |
(7) |
and hence
points in the direction of the normal
to the spheroid at . i.e. The tangent plane at any point
on the spheroid is the reflecting surface that reflects a signal from
to , and by symmetry the locus
of is then the intersection of the spheroid with a plane
which passes through the origin of .
To describe this intersection, we define a further co-ordinate system,
 , which has the same origin as , but with the , which has the same origin as , but with the  direction normal to the intersection plane, and the
  direction perpendicular to this, but within the vertical plane containing
both and (see Figure 4).
We can link the frames and by a rotation matrix,
direction perpendicular to this, but within the vertical plane containing
both and (see Figure 4).
We can link the frames and by a rotation matrix,  ,
such that ,
such that
 |
(8) |
To set up the axes in practice, we calculate a point of intersection
( in Figure 4) of the vertical plane
through and with the spheroid, and with a
horizontal normal. Then we calculate a point on the spheroid with
 and a horizontal normal. Combined with the origin, we
then have three non-co-linear points; sufficient to derive the plane
normal, and a horizontal normal. Combined with the origin, we
then have three non-co-linear points; sufficient to derive the plane
normal,  . When is normalised, (8)
implies that . When is normalised, (8)
implies that
 |
(9) |
We choose  to point from the origin to the point ,
which implicitly defines the direction of in the Cartesian
frame. We can then relate the frames and by a rotation
matrix and assert, to point from the origin to the point ,
which implicitly defines the direction of in the Cartesian
frame. We can then relate the frames and by a rotation
matrix and assert,
 |
(10) |
which, referring back to (2), defines an elliptical
intersection in the  plane. plane.
Once the ellipse parameters have been calculated, we can perform SRSV
by transforming the vertices of SRSV cells to that co-ordinate system,
and searching for interceptions of the faces with the ellipse.
We can extend the basic premise of SRSV by accounting for surface
normals, vastly simplifying any subsequent analysis. When a spheroid
intersects a cell, there is an associated average normal to the spheroid
within that cell. If there is to be a reflecting surface giving rise
to that spheroid within that cell, it must have a normal direction
parallel to the spheroid normal. Thus, we can associate each SRSV
vote within a cell with a particular three dimensional normal direction.
In practice, we associate a series of angular bins with each cell,
and add votes to the angular bin that contains the average spheroid
normal within that cell. If a planar reflecting surface exists within
that cell, the SRSV count for the angular bin containing its normal
direction should vastly exceed the counts in the remaining angular
bins.
When considering vertical walls, we need only associate cells with
angular bins in the horizontal plane. We calculate the average normal
to the ellipse within each cell it intersects, project that direction
into the horizontal plane and increment the relevant angular bin for
the cell. This is a particularly useful representation when searching
for walls, since we are really searching for contiguous, vertical,
planar surfaces that extend across multiple cells, all with high SRSV
counts in the angular bin corresponding to the surface normal.
Experimental validation was performed by post-processing real reflections
collected from the Bat system. We have logged the reflections, caught
in a communal coffee area, for Bats worn by personnel for a period
of two days, producing a distribution of sightings and reflections
typical for an area in daily use. Figure 5
illustrates the shape of the area and any fixed objects (hatched)
and identifies three key Regions within it (labelled 1,2,3). Region
1 is used as a through-way, with people rarely stopping. Consequently,
we see a low number of sightings here. Region 2 is a general communal
area, where people tend to congregate and remain for extended periods
of time, building up large numbers of sightings. Region 3 is an area
with a low density of Bat receivers in the ceiling, and a high density
of ceiling obstructions. Relative to Regions 1 and 2, sightings are
rare here.
 |
| (a) A schematic view of the communal coffee area |
 |
| (b) The distribution of sightings collected during testing |
 |
| (c) A representation of the room walls using the same collapsed column grid as (b). The arrows show door positions. |
Figure 5:
The testing area
Figure 5(b) shows the actual distribution of
sightings collected during the test period. This data was processed using an SRSV cell size of 0.2m, using 6897
collected reflections. The initial result is shown in Figure 6;
the SRSV counts shown are the sums of each vertical column of SRSV
cells. This `collapsed column' representation helps to capture
the fact that the walls are vertical and thus all cells in a vertical
column provide evidence for a wall at that position.
 |
Figure 6:
The column-collapsed SRSV grid for
the coffee area from a series of viewing angles
The highly non-uniform usage of the area by personnel is reflected
in the results. We see a high density of intersections in Region 2,
a direct result of users remaining in roughly the same place for many
sightings, building up intersections in that Region. There are strong
maxima in the SRSV counts in Region 2, which correctly trace out the
walls on either side. Note that the SRSV count inside this Region
is non-zero, increasing with the number of sightings, despite the
fact that there can be no wall there. This potentially misleading
situation illustrates the need to store the SRSV normal directions
in angular bins. Figure 7 shows the same data,
but for a specific angular bin of width  containing
the wall normal direction. We see that the SRSV counts within Region
2 are drastically reduced, since the high counts in Figure 6
are distributed across the angular bins in the SRSV cell. containing
the wall normal direction. We see that the SRSV counts within Region
2 are drastically reduced, since the high counts in Figure 6
are distributed across the angular bins in the SRSV cell.
 |
Figure 7:
The SRSV count for angular bins containing
direction
 . .
 |
| (a) Correct representation of the test area (grey cells
represent doors). |
 |
| (b) Results of SRSV (grey cells show the eroded sighting distribution) |
Figure 8:
SRSV Results
We can further improve each angular view by excluding cells in a column
that has seen a sighting of a Bat (thereby implying no wall can be
there). In practice, to account for positioning inaccuracies and the
small possibility of a wall and a Bat coexisting within a cell of
finite size, we have found it best to erode the area of sightings
by one cell in every direction. This leaves us with a core shape of
sightings that we are confident covers cells that do not contain walls.
To encapsulate this fact, we zero the SRSV count for any column within
which a Bat was sighted.
To extract the wall positions, we applied the following simple algorithm
for the four normal directions that follow the axes of the SRSV grid:
- Create the SRSV grid for the angular bin containing the normal (e.g.
Figure 7) of interest.
- Set SRSV counts to zero for cells contained in the eroded region of
sightings
- Scan the grid perpendicular to the normal direction, amalgamating
cells with non-zero SRSV counts into single 'walls', allowing a maximum
gap of two cells (0.4m) within each. This gap allows for wall continuity
across regions of low or no occupancy.
- Calculate the average SRSV count for each wall, and assign the value
to each cell within the wall.
- Scan the grid parallel to the normal direction, taking the cell with
the maximum average SRSV count as containing a wall.
The results of applying this algorithm are presented in Figure 8,
and are encouraging.
The position and orientation of the longer side walls has been correctly
extracted, with the overall room shape being determined to a good
approximation. Despite the vastly different usages of Regions 1 and
2, we are still able to extract the wall positions with good accuracy.
The door positions, shown in Figure 8(a),
are clearly present, with the exception of the top-most door. This
door leads to an office that was not in use during testing, and hence
the door remained closed, completing the wall.
 |
| (a) A graphical representation of the room and its
furniture |
 |
| (b) Correct representation of the room on the SRSV grid |
 |
| (c) Results of SRSV (grey cells show eroded sighting distribution)
furniture |
Figure 9:
The results of applying SRSV to
another room.
Importantly, the method is clearly superior to simply using the sighting
distribution to determine the room shape, as shown by the shaded
region of Figure 8(b).
The SRSV method is capable of inferring wall positions in areas penetrated
by ultrasonic signals, but where Bats are not sighted. This is a useful
feature in office environments, where desks and machines typically
obstruct users from entering areas adjacent to walls.
The extraction algorithm used works well when we specify the normal
axes to examine. However, the vast majority of office buildings contain
rectangular rooms, so such a scenario is not contrived. The principal
axes may be entered by hand, or we may make the assumption that once
the orientation of one room or wall is determined, we give precedence
to the same normal direction (and those parallel and perpendicular
to it) throughout the building. Determination of a single wall orientation
is possible by simply looking for a long sequence of cells with locally
high SRSV counts in angular bins consistent with the sequence normal,
or by using more complex image techniques such as a Hough Transform
[8].
For comparison, Figure 9 gives a representation
of another room within our Laboratory, and the results of applying
SRSV analysis to sightings recorded within it over a period of three
days. Here, we find the results to be similarly encouraging. The absence
of a colleague who sits in the top left corner of 9(a)
during the testing period resulted in poor determination of walls
in that area, as expected. However, the remaining wall positions were
correctly determined. In particular, it is interesting to note that
the filing cabinets marked in 9(a)
were treated as an extension of the wall nearby due to the large,
smooth and vertical surface they presented.
To demonstrate the evolution of SRSV data as sightings are collected,
a further dataset was collected from within a long, straight corridor.
This gave a further opportunity to test the method, and a very strong
feature to examine, in the form of one of the walls.
 |
(a)  =10 =10 |
 |
| (b) =100 |
 |
| (c) =500 |
 |
| (d) =1000 |
 |
| (e) =1500 |
 |
| (f) =2500 |
 |
| (g) 8=4000 |
Figure 10:
Evolution of an SRSV grid. The
graphs show a view along the length of a corridor. A wall is located
within horizontal bin 10
A total of 4000 sightings were analysed, collected over a period of
one day. Figure 10 shows a series of views of
the collapsed grid count for a normal direction perpendicular to one
of the walls after different numbers of sightings, . The correct
wall position lies within the bin labelled 10 in the graphs. The
evolution of a peak within this bin is clearly evident.
It is important to realise that we cannot accurately define the number
of sightings required to extract a feature. There is no guaranteed
number of single reflections associated with each sighting, and
furthermore no guarantee that the sightings are distributed in such a
way as to produce reflections along the entire length of the feature.
This can be observed in Figure 10 by the
apparent lack in difference between 10(f) and
10(g). Nevertheless, the graphs shown in
Figure 10 serve to illustrate a typical
evolution.
SRSV offers the opportunity to detect static and dynamic details of
great use to the pervasive computing community. Whilst in this paper
we have applied SRSV analysis in the context of static vertical walls,
the concept is not limited to them. We can also detect other vertical
features, such as dynamic walls (temporary partitions), door positions
and states (open or closed), and positions and orientations of
monitors (particularly useful in the context of hot-desking).
Note that the analysis algorithm for the SRSV grid may need to be
tailored to extract features of limited extent, such as monitors. The
algorithm presented above searches for long, contiguous lines within
the collapsed grid, which we would not expect to observe for monitors.
Instead, we would search for well-defined, bounded planes of normals
at heights useful for displays.
It is possible to apply the same ideas to non-vertical surfaces by a
straightforward coordinate rotation. In the specific case of the Bat
system, however, there is little information to be gained about
non-vertical surfaces. This is due to the directional nature of the
ultrasonic emission from a Bat.
Since the Bat receivers are designed to be ceiling mounted, the
ultrasonic emission from Bats is designed to be directed primarily
upward, toward the ceiling. Furthermore, for most of time Bats are
worn by personnel at heights consistent with the characteristic
standing and sitting heights of those people. Non-vertical surfaces,
such as tables, are consequently below the usual height of the Bat,
and it is unlikely that a signal from the Bat will reflect from them
and reach the receivers.
Use of the method to find only vertical surfaces with Bat system data
does not imply any limitation of its use with other positioning
systems. For example, signals in proposed UWB positioning systems
would be expected to reflect extensively from surfaces of all
orientations within the environment.
We have presented a novel method for surface discovery using reflections.
Our results indicate that it can potentially provide a rich source
of world information. Our implementation has centred around wall detection,
which we have demonstrated with good results based on a relatively
small data set. The method in general, however, is easily extended
to search for non-vertical reflecting surfaces, by using intersection
of prolate spheroids and SRSV cells which record intersection normals
in three dimensions.
We envisage this data source being combined with other sources (many
of which are discarded by today's positioning systems) to provide
robust information about the environment. In particular, we hope to
use these, and related, techniques to determine the position and orientation
of large flat-screen displays - a common source of problems for ultrasonic
positioning which we intend to compensate for. Furthermore, the usage of
archived personnel positions can be used to derive complementary
environmental information, such as region connectivity and the
position of large scale objects [9].
Whilst the results presented here are for an ultrasound-based system,
the theory applies equally to any system that can resolve multipathed
effects. In particular, the methods presented here should transfer directly
to Ultra-Wideband (UWB) radio positioning systems, which have the
intrinsic capability of resolving and timing multipathed signals [7].
Beyond the niche of pervasive computing, the method can be applied
to autonomous navigation and map building. In these fields, we typically
use a variety of ranging and signal bouncing techniques to permit
a robot to `learn' its environment using probabilistic methods
[15]. SRSV here could provide a useful extra information
source that improves the probability calculations. Furthermore, such
a robot can be programmed to adopt a motion pattern that targeted
specific areas of uncertainty within an environment.
The authors are grateful to both the EPSRC and AT&T for supporting
this work through a research grant and CASE award respectively.
- 1
-
M. Addlesee, R. Curwen, S. Hodges, J. Newman, P. Steggles, A. Ward, and
A. Hopper.
Implementing a sentient computing system.
IEEE Computer, 34(8), August 2001.
- 2
-
P. Bahl and V. N. Padmanabhan.
RADAR: An in-building RF-based user location and tracking system.
In INFOCOM 2, pages 775-774, 2000.
- 3
-
P. Bahl, V. N. Padmanabhan, and A. Balachandran.
Enhancements to the RADAR user location and tracking system.
Technical report, Microsoft Research, February 2000.
- 4
-
B. Barshan.
Ultrasonic surface profile determination by spatial voting.
In Proceedings of the IEEE Instrumentation and Measurement
Technology Conference, Budapest, Hungary, pages 583-588, May 2001.
- 5
-
B. Barshan and D. Baskent.
Comparison of two methods of surface profile extraction from multiple
ultrasonic range measurements.
Meas. Sci. Technology, 11:833-844, April 2000.
- 6
-
D. Bohn.
Environmental effects on the speed of sound.
Journal of the Audio Engineering Society, 36(4):223-231, April
1988.
- 7
-
Time Domain.
PulsOn technology overview.
Technical report, Time Domain Corporation, 2001.
https://www.timedomain.com.
- 8
-
R. O. Duda and P. E. Hart.
Use of the hough transform to detect lines and curves in pictures.
Communications of the ACM, 15(1):11-15, 1972.
- 9
-
R.K. Harle and A. Hopper.
Using Personnel Movements For Indoor Autonomous
Environment Discovery.
To appear in PerCom 2003, 2003.
- 10
-
J. Hightower and G. Borriello.
Location sensing techniques.
IEEE Computer, August 2001.
- 11
-
R. M. Murray, Z. Li, and S. S. Sastroy.
A Mathematical Introduction to Robotic Manipulation.
CRC Press, 1994.
- 12
-
N. B. Priyantha and A. Chakraborty and H. Balakrishnan.
The Cricket Location-Support System.
Proceedings of the Sixth Annual ACM International Conference on
Mobile Computing Networking, August 2000.
- 13
-
W. H. Press, S. A. Teukolsky, W. T. Vetterling, and B. P. Flannery.
Numerical Recipes in C.
CUP, 1992.
- 14
-
N. B. Priyantha, K. L. M. Allen, H. Balakrishnan, and S. J. Teller.
The cricket compass for context-aware mobile applications.
In Mobile Computing and Networking, pages 1-14, 2001.
- 15
-
S. Thrun.
Learning maps for indoor mobile robot navigation.
Artificial Intelligence, 99(1):21-71, 1998.
- 16
-
A. M. R. Ward.
Sensor-driven Computing.
PhD thesis, Cambridge University, August 1998.
|