To be effective, the location anonymizer requires location-based services that are used with precise position information by a large user base. We anticipate that such services will soon be available based on telematics, mobile phone, or wireless community network platforms. To our knowledge, no such suitable testbed exists to date. Therefore, we implemented the anonymization algorithms on a Java server platform and evaluated them using automotive traffic simulations based on US geological survey (USGS) cartographic material.
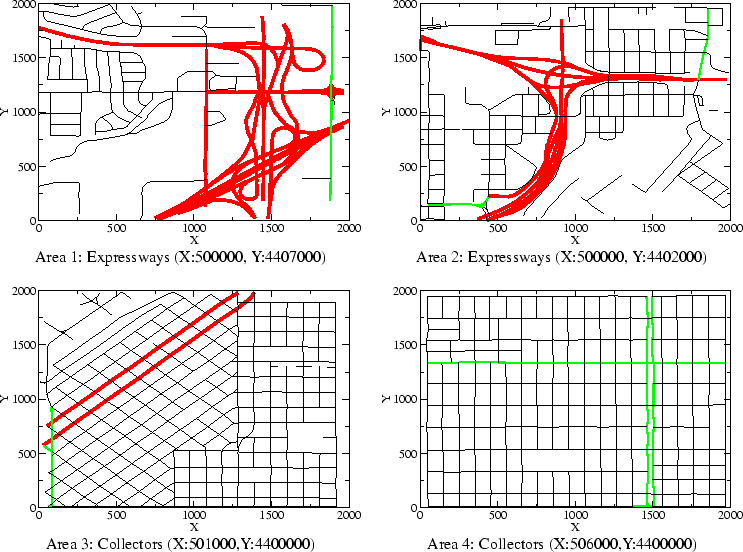
The USGS publishes detailed transportation network information at the city level in the Spatial Data Transfer Standard [33]. We extracted vector coordinates of primary, secondary, and minor roads from the transportation layer of the 1 : 24, 000 scale Digital Line Graph [34] data files. The data has a resolution of 0.61m. Specifically, we selected 2000x2000m areas from the city of Denver, Colorado, where we had access to traffic count statistics. Figure 1 shows maps of selected areas. The thickest lines indicate expressways, the medium lines arterials, and the thin lines collector streets. Two maps (area 1, area 2) included predominantly expressways, the other maps (area 3, area 4) mostly collector streets. Coordinates are given in meters in zone 13 of the Universal Transverse Mercator (UTM) projection using the North American 83 geodetic datum.
 |
A traffic study [35] reports the 24 hour traffic volume at specific points along roads. We averaged the counts for different urban road types and mapped them onto the USGS road classes as shown in Table 3. Traffic volume was computed as the average 24 hour bi-directional traffic count.
|
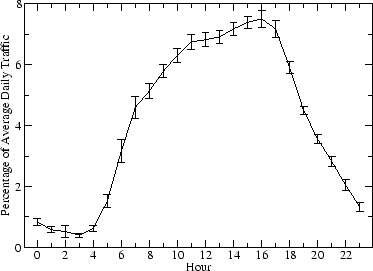
The algorithms are evaluated at different times of day, because traffic volume changes heavily between peak and night hours. An adjustment factor for each hour was derived as follows. The Colorado Department of Transportation maintains continuous traffic counters along several highways. For each hour of a day, we calculated the percentage of total daily traffic present during this hour from the mean August 2002 traffic counts for 25 highways [36]. Figure 2 shows the results marked with 95% confidence intervals.
To create a traffic snapshot for a given hour, we place vehicles on the road segments according to a uniform stochastic process. The number of vehicles on a road segment n is determined by

For all experiments we assume an average velocity v of 10m/s and report mean results for a 24-hour period, that is, one snapshot for each hour of day. Unless otherwise stated, the anonymity constraint kmin was set to 5, which we intuitively judge as a fair level of anonymity.