|
USENIX 2006 Annual Technical Conference Refereed Paper
[USENIX 2006 Annual Technical Conference Technical Program]


Disk Drive Level Workload Characterization
| Alma Riska |
Erik Riedel |
| Seagate Research |
Seagate Research |
| 1251 Waterfront Place |
1251 Waterfront Place |
| Pittsburgh, PA 15222 |
Pittsburgh, PA 15222 |
| Alma.Riska@seagate.com |
Erik.Riedel@seagate.com |
In this paper, we present a characterization of disk drive workloads measured in systems representing the enterprise, desktop,
and consumer electronics environments. We observe that the common characteristics across all traces are disk drive idleness and
workload burstiness. Our analysis shows that the majority of characteristics, including request disk arrival rate, response time,
service time, WRITE performance, and request size, are environment dependent. However, characteristics such as READ/WRITE
ratio and access pattern are application dependent.
1 Introduction
Hard disk drives have become the only versatile form of persistent storage that offers reliability, high performance, and
a wide range of form factors and capacities, which best suits the needs of highly dynamic and ever changing computing environments.
Currently, storage solutions are in demand not only from traditional computer systems, such as the high-end servers, desktop and
notebook PCs, but also from the very fast growing sector of consumer electronics.
We stress that it is critical to distinguish the environment where disk drives operate, because traditionally different
hardware is used in different environments. For example the high performing SCSI disk drives are used in the
enterprise environment while ATA/IDE disk drives are used in the desktop/notebook and consumer electronics
environments [2]. The understanding of per-environment workload characteristics
guides the decision making to support a specific application with the right hardware.
Because storage is the slowest processing unit in a computer system,
accurate IO workload characterization allows for efficient
storage optimization [1,6,14], which
targets the specific requirements of the computing environment.
The focus of IO workload characterization has always been on large
high-end multi-user computer systems [11,13], because of the criticality
of the applications running there, such as databases, Internet services, and
scientific applications. Nevertheless, behavior of file systems is evaluated
across various environments in [12]. The file system workload
in personal computers is characterized in [16] and particularly
for Windows NT workstations in [15].
With the workload characterization that we present here, we intend to cover
all computing environments where modern disk drives are used, i.e, enterprise, desktop PCs, and
consumer electronics. Different from all previous
work [11,12,13]
on tracing the storage system, we do not need to modify the software stack,
because the measurements are conducted outside the system by attaching a SCSI or IDE analyzer to the IO bus and intercepting
the electrical signals.
Our traces are measured at the disk level or the RAID-array controller level
in various systems, including web servers, e-mail servers, game consoles, and
personal video recorders (PVR).
This set of disk level traces represents the majority of IO workloads.
Traces are measured in both production and controlled systems. In
controlled systems, only the scenario under which the application runs
is controlled.
All measurements were taken during the 2004 calendar year in state-of-the-art
systems at the time.
Our evaluation tends to agree with previous work
[5,12,13] on the application-dependent nature
of IO workload characteristics. We observe that READ/WRITE ratio, access
pattern, and WRITE traffic handling vary by application.
However, the majority of characteristics vary only by environment. Environment
dependent characteristics include request disk arrival rate, service time,
response time, sequentiality, and average length of idle intervals.
We observe that CE tends to be a more variable
environment when it comes to workload characteristics than the desktop or
enterprise ones.
Despite workload dependencies on specific applications and environments,
there are
characteristics that describe the overall IO workload that remain consistent
through applications and environments. One of them
is workload burstiness. We observe that disk level workload is bursty
similarly to network [10],
Web server [4], and file system traffic [8].
Because the evaluation of disk drive workload burstiness is critical for devising
accurate disk drive synthetic workload generators [5]
and predictions of storage system behavior [7], we quantify it and
show that burstiness is exhibited at the disk drive level in almost all
computing environments.
The rest of this paper is organized as follows. In
Section 2, we explain the measurement environments and
give the trace format. In Section 3,
we present general characterization of the trace data.
Section 4 presents a detailed analysis of the interarrival
process captured by our traces. In Section 5, we
discuss the characteristics of the service process in our traces.
We conclude with Section 6 where we
summarize our results.
2 Measurement Environment
In this paper, we characterize disk drive workloads with respect
to different computing environments, categorized based on their
complexity, applications, and performance requirements as follows:
 Enterprise, which includes high-end computer systems,
where the storage system often consists of RAID arrays
and supports applications such as web, databases, and e-mail servers.
Enterprise, which includes high-end computer systems,
where the storage system often consists of RAID arrays
and supports applications such as web, databases, and e-mail servers.
Desktop, which includes personal computers with single disk
drives, that support single-user applications.
Consumer Electronics - CE, which includes consumer electronic
devices that have a disk drive for their storage needs.
CE devices include PVRs, game consoles, MP3 players, and digital cameras.
Table 1:
General characteristics. Traces are identified by the
application, dedicatedly supported by the storage system.
| Trace |
Enviro |
No of |
Length |
# of |
R/W |
Bus |
Avg. Bus |
Avg. |
Avg./Max |
| -nment |
Disks |
|
Reqs. |
% |
Idle |
Idle Int |
Resp. Time |
QL |
| Web |
ENT |
1 |
7.3 hrs |
114,814 |
44/56 |
96% |
274 ms |
13.06 ms |
1 /16 |
| E-mail |
ENT |
42 |
25 hrs |
1,606,434 |
99/1 |
92% |
625 ms |
13.28 ms |
3 / 9 |
| Software Dev. |
ENT |
42 |
12 hrs |
483,563 |
88/12 |
94% |
119 ms |
8.62 ms |
2 / 7 |
| User Accounts |
ENT |
42 |
12 hrs |
168,148 |
87/13 |
98% |
183 ms |
12.82 ms |
3 / 8 |
| Desktop 1 |
DESK |
1 |
21 hrs |
146,248 |
52/48 |
99% |
1000 ms |
3.08 ms |
1 / 1 |
| Desktop 2 |
DESK |
1 |
18 hrs |
159,405 |
15/85 |
99% |
506 ms |
2.63 ms |
1 / 1 |
| Desktop 3 |
DESK |
1 |
24 hrs |
29,779 |
44/56 |
99% |
402 ms |
2.64 ms |
1 / 1 |
| PVR A |
CE |
1 |
20 hrs |
880,672 |
95/5 |
89% |
72 ms |
9.77 ms |
1 / 1 |
| PVR B |
CE |
1 |
2.8 hrs |
138,155 |
54/46 |
82% |
60 ms |
8.20 ms |
1 / 1 |
| MP3 |
CE |
1 |
2.2 hrs |
40,451 |
69/31 |
18% |
37 ms |
5.71 ms |
1 / 1 |
| Game Console |
CE |
1 |
1.4 hrs |
33,076 |
83/17 |
95% |
142 ms |
1.08 ms |
1 / 1 |
|
Because of the Non-Disclosure Agreements that are in place for the
traces evaluated in this paper, we will not explain in detail
the measurement systems. However we note that our enterprise
traces are measured in production systems. This means that
the system owner allowed us to conduct the measurement while
the system was running a daily routine.
Except the Web server, all other enterprise systems are multi-disk
systems configured in RAID arrays. All measured enterprise systems
consist of SCSI disk drives.
In cases when the trace length is less than 24 hours, the measurement
is conducted during business hours.
Actually during the 25 hours of the E-mail trace, the highest burst
of load is during the nightly backup activity.
Currently, we have not conducted measurements in an enterprise database
system, and this is an application category that is lacking in our
trace collection.
The desktop traces are measured on employee' (engineer') PCs operating
under Windows or Linux, while they run their daily applications.
The CE traces are measured in controlled systems (i.e., the scenario of
the application is set by the engineer performing the measurement).
We have two PVR traces measured on the PVRs of two different vendors.
Trace ``PVR A'' runs overnight; it records 2-hour shows continuously,
plays back the shows periodically, and in the same time conducts media scrubbing.
Similarly ``PVR B'' plays back and records simultaneously in a span
of 3 hours.
The ``Game Console'' trace is measured on a game console while a game is played.
The ``MP3'' trace is measured on a networked system with 3 players
and songs that span in a 10-20GB LBA range. All measured
desktop and CE systems consist of ATA/IDE disk drives
All traces are measured using a SCSI or IDE analyzer that intercepts the
IO bus electrical signals and stores them. The signals are decoded at a later
time to generate the final traces. The choice of the analyzer enables trace
collection without modifying the software stack of the targeted system and
does not affect system performance.
Traces record for each request the arrival time and the departure time
in a scale of 1/100 of a millisecond. Since the average service time of a
single disk drive request is several milliseconds, the granularity of the
arrival and departure times is accurate for our evaluation purposes.
In addition, each trace record contains request length in bytes, the first
logical block number of the requested data, the type of each request,
(i.e., READ or WRITE), the disk ID (when measurements are performed in
an array of disks), and the queue length at the disk.
The length of the traces varies from one hour to several hours and the
number of requests in the traces ranges from several thousands to a few
millions.
3 General Analysis
From the extended set of traces that we have, we selected a few
representative ones to make the presentation easier. Table 1
lists all traces that we evaluate in this paper and their main
characteristics such as the number of disks in the system, trace length in hours,
number of requests in the trace, the READ/WRITE ratio,
IO bus idleness, the average length of idle intervals,
the average response time at the disk drive, and the average and maximum queue
length at the drive (as seen by each arriving request).
An important observation from Table 1 is that disks are idle.
Yet bus idleness (which is measured in our traces) does not mean that there
are no outstanding requests in the IO system.
For example, when disk queue depth is one then queuing happens at the file
system and often the bus remains idle for less than 1 ms between one disk
request completion and a new disk request arrival.
Identifying idleness at the disk drive is important when it comes to
scheduling background activities such as scrubbing, flushing the cache,
and powering down the disk (to save energy).
Note that different background activities have different requirements for
idleness. While scrubbing and flushing the cache can be completed in
intervals of tens to hundreds of milliseconds, powering down should be
triggered for idle intervals of more than several seconds or minutes.
Our traces indicate that the percentage of idle intervals larger than
200 ms account for, in average, 20%, 50%, and 35%
of all idle intervals of at least 1 ms in the enterprise, desktop, and
CE environments, respectively.
The average response time (see Table 1) in all systems is
only several milliseconds.
For the enterprise traces, response time is the sum of the queuing time
and service time (as many as 16 requests are queued at the measured SCSI
drives). For the desktop and CE traces, because there is no queueing,
the response time approximates service time at the disk drive, reasonably well.
The access pattern, (i.e., the request position), is among the most
important characteristics of disk drive workloads, because it is
related to the disk service process.
In general, it is accepted that enterprise and desktop environments
operate under mostly random workloads, (i.e., requests are distributed
uniformly on (and across) disk surfaces).
Random workloads have high service demands, because the disk arm has to
seek from one track to the next.
On the other hand, sequential IO workloads, often associated with
video/audio streaming in various CE devices, require only moderate head
movements and, consecutively, have low service demands.
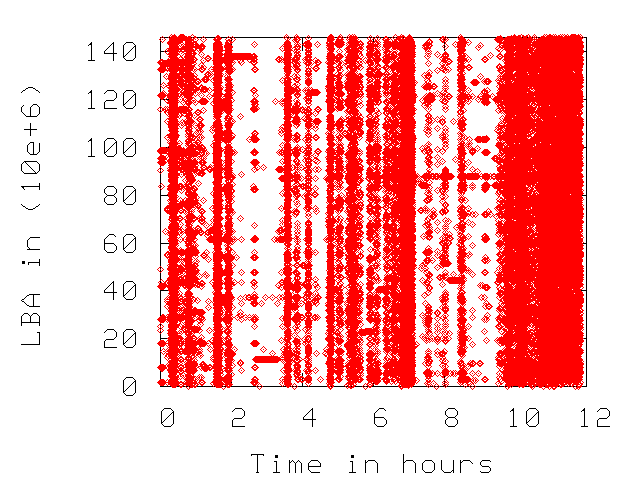
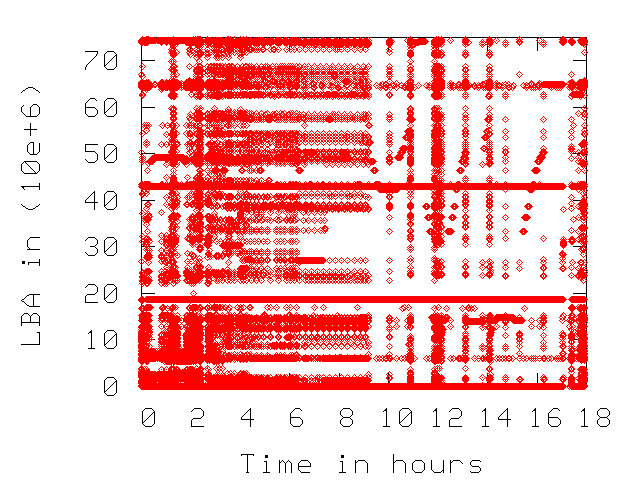
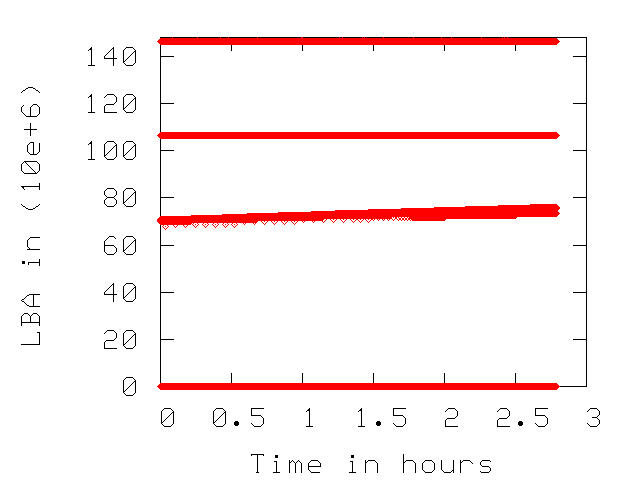
Figure 1 depicts the access patterns for three of
the traces of Table 1.
As expected, the access pattern for enterprise is more random than
for desktop and the CE is highly sequential. Note that the range of
accessed LBAs spans throughout the available space at the disk,
indicating that (at least for enterprise and desktop) the disks
operate close to their capacity and most data is accessed during
the measurement period
Figure 1:
Access pattern (LBA accessed across time). Horizontal lines indicate sequential disk accesses.
Software Dev. |
|
Desktop 2 |
|
PVR B |
|
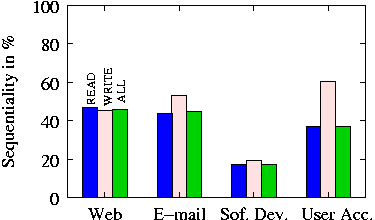
We observe that in enterprise systems the degree of sequentiality
between READs and WRITEs is different. WRITEs are more sequential
than READs because various caches in the IO path
coalesce small WRITEs for better performance.
We measure the degree of sequentiality as the portion of requests from
the IO stream that is fully sequential (i.e. end LBA of a request is the
start LBA for the consecutive one) and show it in
Figure 2 only for enterprise traces. CE traces
have a sequentiality twice as much as enterprise traces and omitted here
due to lack of space.
Figure 2:
Sequentiality of traffic in enterprise environment.
The measure is the portion of fully sequential requests to
the total number of requests for READs, WRITEs, and both.
|
Table 2 shows statistics on
request size. Note that the mean of request sizes varies
while the variability of them (measured via the coefficient
of variation) is consistently low. Across all traces, the common
request size is 4KB (third column in
Table 2),
except the video streaming and game console which issue 128KB
requests. The largest measured request size is 128KB
although in both Software Development and E-mail traces there
are occurrences (5 in total per trace) of requests larger than
128KB (but no more than 244KB).
Table 2:
The mean and the coefficient of variation
of request sizes. The third and the fourth column
show the two most common sizes in KB and their respective
portion for each trace.
| Trace |
Mean |
CV |
Common Req. Sizes |
| |
|
1st |
2nd |
| Web |
16K |
1.4 |
4K(55%) |
64K(17%) |
| E-mail |
16K |
1.2 |
4K(60%) |
8K(8 %) |
| Software Dev. |
20K |
1.2 |
4K(40%) |
16K(17%) |
| User Accounts |
23K |
1.3 |
4K(43%) |
8K(11%) |
| Desktop 1 |
10K |
1.3 |
4K(56%) |
.5K(20%) |
| Desktop 2 |
23K |
1.1 |
4K(41%) |
64K(24%) |
| Desktop 3 |
13K |
1.3 |
4K(34%) |
.5K(20%) |
| PVR A |
5K |
2.4 |
4K(30%) |
1K(22%) |
| PVR B |
42K |
1.3 |
128K(29%) |
8K(21%) |
| MP3 Player |
12K |
1.0 |
4K(62%) |
32K(26%) |
| Game Console |
54K |
0.9 |
128K(27%) |
64K(12%) |
|
In designing storage systems, particularly the high-end ones,
considerable effort goes to handling WRITE traffic efficiently
because it is related to both performance and reliability.
NVRAM, which safely stores the data even during power outages and
system crashes, is seen as an attractive feature in various levels
of the IO path, to optimize handling of WRITE traffic [13].
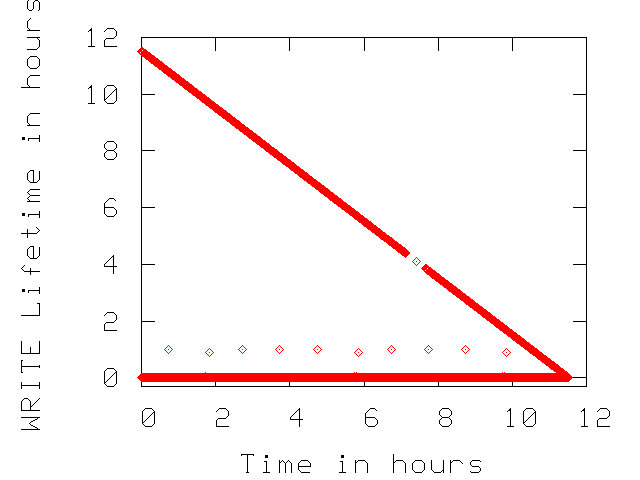
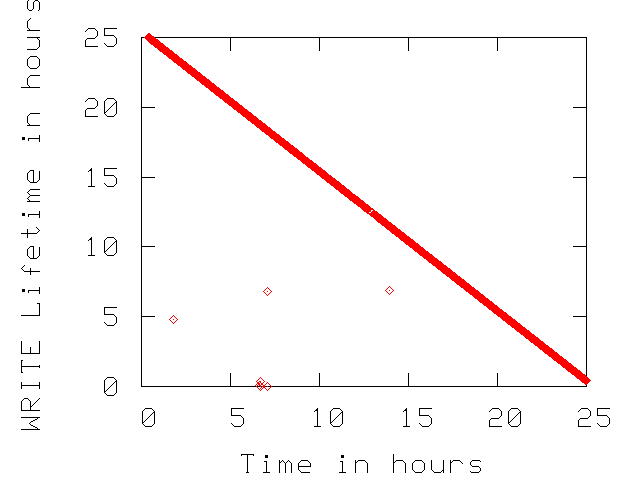
In Figure 3, we present WRITEs lifetime as
a function of time for three traces from Table 1.
For each WRITE request, we note if any of its blocks are rewritten
again for the duration of the trace. If a set of blocks are not
re-written then their WRITE lifetime is the remaining of trace duration.
Non re-written blocks fall on the diagonals of the plots in
Figure 3.
We observe that the enterprise environments such as the
``E-mail'' trace does not overwrite any data written during the measurement
period. This indicates that the upper layers of the IO path effectively
optimize WRITE traffic to the disk drive.
The ``User Accounts'' trace is expected to consists of requests that update
file system metadata and have stringent consistency requirements, (i.e.,
the file system forces the data to the disk rather than keeping it in any
of the caches of the IO path). This system behavior causes a portion of WRITE
traffic to get re-written in short time intervals.
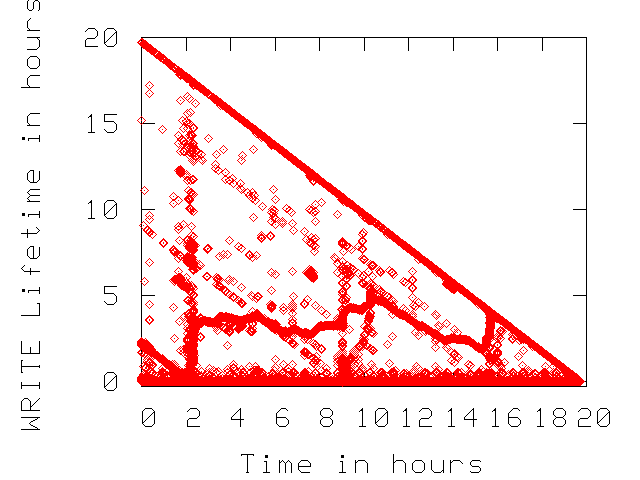
In the CE traces (see the ``PVR A'' plot in Figure 3),
there is no NVRAM to optimize WRITE traffic, hence there are many re-written
blocks during the traces.
Figure 3:
Lifetime of each WRITE across time. The non-overwritten WRITEs fall
on the diagonal of the plots.
User Accounts |
|
E-mail |
|
PVR A |
|
4 Interarrival Times
We present the general statistical properties of the request
interarrival times, (i.e., mean and coefficient of variation)
in Table 3.
Note that enterprise and CE traces have higher average arrival
rates than the desktop ones.
The interarrival times are consistently variable with CVs being
as high as 19, except for the the CE traces. We expect
CE applications, which mostly stream video/audio, to have low
variability in the interarrival times.
Table 3:
The mean and the coefficient of variation
of interarrival and service times for our traces.
| Trace |
Interarrival times |
Service
times |
| Mean |
CV |
Mean |
CV |
| Web |
229.6 |
6.3 |
6.64 |
0.69 |
| E-mail |
56.9 |
9.0 |
5.59 |
0.75 |
| Software Dev. |
88.0 |
12.3 |
6.34 |
0.84 |
| User Accounts |
246.6 |
3.8 |
6.10 |
0.74 |
| Desktop 1 |
509.8 |
17.7 |
3.08 |
2.22 |
| Desktop 2 |
405.0 |
7.0 |
2.63 |
1.98 |
| Desktop 3 |
2882.2 |
19.2 |
2.64 |
1.97 |
| PVR A |
80.6 |
8.2 |
9.77 |
0.55 |
| PVR B |
72.7 |
1.0 |
8.20 |
1.24 |
| MP3 Player |
195.2 |
2.1 |
5.71 |
2.38 |
| Game Console |
148.4 |
3.2 |
1.08 |
0.83 |
|
We also focus on burstiness of arrivals and estimate the Hurst
parameter, which is widely used to quantify long-range dependence
and burstiness [3,10].
We use the Selfis [9] tool to compute the Hurst parameter
using two different techniques, (i.e., the Aggregate variance,
and the Peridogram). Details on these two techniques can be found in
[3]. We present our results in Table 4.
Note that a Hurst parameter value of 0.5 or larger indicates long-range
dependence [3] in the time series (in our case the series of
interarrival times). We conclude that interarrival times at the disk
drive are long-range dependent, because all values in Table 4
are larger than 0.5. One of the direct consequences of long-range dependent
interarrival times is on the queuing behavior and saturation, which
happens faster under long-range dependent than independent interarrival times.
Table 4:
Hurst parameters of interarrival times and seek distances computed via
the Aggregate Variance and Peridogram methods.
| Trace |
Interarrival time |
Seek Distance |
| Aggregate |
Peridogram |
Aggregate |
Peridogram |
| Variance |
|
Variance |
|
| Web Server |
0.81 |
0.672 |
0.89 |
0.972 |
| E-mail |
0.83 |
0.727 |
0.76 |
0.734 |
| User Acc. |
0.75 |
0.782 |
0.78 |
0.758 |
| Soft.Dev. |
0.79 |
0.498 |
0.75 |
0.885 |
| Desktop 1 |
0.71 |
0.593 |
0.78 |
1.002 |
| Desktop 2 |
0.84 |
0.675 |
0.82 |
0.938 |
| Desktop 3 |
0.73 |
0.640 |
0.88 |
0.963 |
| PVR A |
0.86 |
0.614 |
0.87 |
0.873 |
| PVR B |
0.54 |
0.577 |
0.59 |
0.243 |
| MP3 Player |
0.83 |
0.928 |
0.74 |
0.976 |
| Game Console |
0.82 |
0.842 |
0.87 |
1.248 |
|
5 Service Process
In this section, we focus on the service process at the disk drive for traces
of Table 1.
Recall that in our traces, we record only the arrival time and the departure
time per request. Because there is no queuing for desktop and CE traces,
the difference between departure and arrival times accurately approximates
the service time at the disk drive. For the SCSI traces where queuing is
present at the disk, we estimate the characteristics of the service process
by using the data of only those requests that find an empty queue at the disk
upon arrival.
Note that such an approximation of the service time process is not far from
the real one, because the load in our enterprise traces is light and most busy
periods have only one request.
Table 3 shows the mean and the coefficient of variation
for the estimated service times of our traces.
Observe that the average service time is several milliseconds. Note that a CV
less than 1 indicates that a process has lower variability than
the well-behaved exponential distribution whose CV is 1.
Enterprise and desktop environments perform consistently within the environment.
Desktop traces have lower service times and higher CVs than enterprise traces because,
first, our desktop traces are more sequential than enterprise ones, and, second,
because desktop drives operate with WRITE-back cache enabled and enterprise drives
operate with WRITE-through cache enabled. The latter is easily extracted
from the traces, because the majority of WRITEs in the desktop traces
take less than a millisecond to complete.
The CE environment shows inconsistency in the mean and CV of service times
across traces, making the CE service process application dependent.
We also analyze the dependence structure of request positions, as a way to
understand dependencies in the service process and access patterns at the
disk drive level. We compute the Hurst parameter for seek (LBA) distances
between consecutive requests and present the results in Table 4.
Recall that for each request in the trace, we
record the start LBA and the request size. Hence, we compute the seek distance
as the difference between the start-LBA of each requests and the end-LBA of
the previous request.
Note that the seek distances in all traces exhibit extreme long-range dependence.
Quantitatively, seek-distances exhibit stronger long-range dependence than the
interarrival times (shown in Table 4 as well).
Such behavior again confirms that locality is an inherent characteristic of disk
drive workloads [13].
Although, enterprise workloads are more random than the desktop or CE ones, in
enterprise systems, there are several IO schedulers and caches in the layered
IO path that order and coalesce requests such that the logical seek distances
between consecutive requests is minimized.
6 Conclusions
In this paper, we characterized disk drive workloads in three different
computing environments, (i.e., enterprise, desktop, and consumer electronics).
Our evaluation agrees with previous work, on the application-dependent nature
of IO workload characteristics. We observe that READ/WRITE ratio, access
pattern, handling of WRITES vary by specific applications.
However, the majority of characteristics vary only by environment.
Environment dependent characteristics include the length of idle intervals,
request arrival rate, request disk service time and response time,
workload sequentiality, WRITE performance, and request size.
More importantly, there are characteristics of the overall IO workload
that do remain consistent through applications and environments. One of particular
note is workload burstiness (i.e., long-range dependence).
We observe that disk level workloads, in particular, request interarrival times
and request seek distances are long-range dependent. Long-range
dependence, as a measure of temporal locality in a time series, has a variety of
consequences in particular when it comes to predict overall system and specific
resource saturation. As a result, burstiness should be taken
under consideration when designing new storage systems, and resource
management policies at various layers of the IO path.
We would like to thank James Dykes, Jinglei Li, and Scott Borton for all
their efforts collecting and parsing these traces and making them available
to us. We would like to thank Kimberly Keeton for excellent shepherding
of our paper. Her comments and the comments of the anonymous reviewers
greatly improved the presentation of this paper.
- 1
-
ALVAREZ, G., KEETON, K., RIEDEL, E., AND UYSAL, M.
Characterizing data-intensive workloads on modern disk arrays.
In Proceedings of the Workshop on Computer Architecture
Evaluation using Commercial Workloads (2001).
- 2
-
ANDERSON, D., DYKES, J., AND RIEDEL, E.
SCSI vs. ATA - More than an interface.
In Proceedings of the 2nd USENIX Conference on File and
Storage Technologies, (FAST'03) (San Francisco, CA, 2003).
- 3
-
BERAN, J.
Statistics for Long-Memory Processes.
Chapman & Hall, New York, 1994.
- 4
-
CROVELLA, M. E., AND BESTAVROS, A.
Self-similarity in world wide web traffic: evidence and possible
causes.
In SIGMETRICS '96: Proceedings of the 1996 ACM SIGMETRICS
international conference on Measurement and modeling of computer systems
(1996), ACM Press, pp. 160-169.
- 5
-
GANGER, G. R.
Generating representative synthetic workloads: an unsolved problem.
In Proceedings of Computer Measurement Group (CMG)
Conference (Dec. 1995), pp. 1263-1269.
- 6
-
GOMEZ, M. E., AND SANTONJA, V.
A new approach in the modeling and generation of synthetic disk
workload.
In Proceedings of the 8th International Symposium on Modeling,
Analysis and Simulation of Computer and Telecommunication Systems;
MASCOTS'00 (2000), IEEE Computer Society, pp. 199-207.
- 7
-
GOMEZ, M. E., AND SANTONJA, V.
On the impact of workload burstiness on disk performance.
In Workload characterization of emerging computer
applications (2001), Kluwer Academic Publishers, pp. 181-201.
- 8
-
GRIBBLE, S. D., MANKU, G. S., ROSELLI, D., BREWER, E. A., GIBSON, T. J.,
AND MILLER, E. L.
Self-similarity in file systems.
In Proceedings of the ACM SIGMETRICS/PERFORMANCE joint
international conference on Measurement and Modeling of Computer Systems
(1998), pp. 141-150.
- 9
-
KARAGIANNIS, T., FALOUTSOS, M., AND MOLLE, M.
A user-friendly self-similarity analysis tool.
Special Section on Tools and Technologies for Networking
Research and Education, ACM SIGCOMM Computer Communication Review 33, 3
(2003), 81-93.
- 10
-
LELAND, W. E., TAQQU, M. S., WILLINGER, W., AND WILSON, D. V.
On the self-similar nature of Ethernet traffic.
IEEE/ACM Transactions on Networking 2 (1994), 1-15.
- 11
-
OUSTERHOUT, J. K., COSTA, H. D., HARRISON, D., KUNZE, J. A., KUPFER,
M. D., AND THOMPSON, J. G.
A trace-driven analysis of the unix 4.2 bsd file system.
In SOSP (1985), pp. 15-24.
- 12
-
ROSELLI, D., LORCH, J. R., AND E.ANDERSON, T.
A comparison of file systems workloads.
In Proceedings of USENIX Technical Annual Conference (2000),
pp. 41-54.
- 13
-
RUEMMLER, C., AND WILKES, J.
Unix disk access patterns.
In Proceedings of the Winter 1993 USENIX Technical
Conference (1993), pp. 313-323.
- 14
-
RUEMMLER, C., AND WILKES, J.
An introduction to disk drive modeling.
Computer 27, 3 (1994), 17-28.
- 15
-
VOGELS, W.
File system usage in windows nt 4.0.
In Proceedings of the ACM Symposium on Operation Systems
Principals (SOSP) (1999), pp. 93-109.
- 16
-
ZHOU, M., AND SMITH, A. . J.
Analysis of personal computer workloads.
In Proceedings of the International symposium on Modeling,
Analysis, and Simulation of Computer and Telecommunication Systems
(MASCOTS) (1999), pp. 208-217.
|