 |

Since reliability has been one of the main thrusts of our current work, the response time behavior of CoDeeN is largely a function of how well the system performs in avoiding bad nodes. In the future, we may work towards optimizing response time by improving the redirector logic, but that has not been our focus to date.
The results of our efforts to detect/avoid bad nodes can be seen in Figure 6, which shows requests that did not receive any service within specific time intervals. When this occurs, the client is likely to stop the connection or visit another page, yielding an easily-identifiable access log entry (MISS/000). These failures can be the result of the origin server being slow or a failure within CoDeeN. The trend shows that both the magnitude and frequency of the failure spikes are decreasing over time. Our most recent change, DNS failure detection, was added in late August, and appears to have yielded positive results.
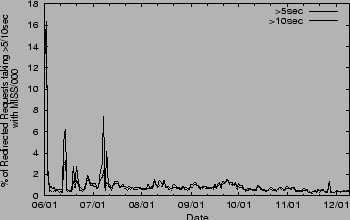
Since we cannot ``normalize'' the traffic over CoDeeN, other measurements are noisier, but also instructive. Figure 7 shows the fraction of small/failed responses that take more than a specific amount of time. Here, we only show redirected requests, which means they are not serviced from the forward proxy cache. By focusing on small responses, we can remove the effects of slow clients downloading large files. We see a similar trend where the failure rate decreases over time. The actual overall response times for successful requests, shown in Figure 8, has a less interesting profile. After a problematic beginning, responses have been relatively smooth. As seen from Figure 5, since the beginning of October, we have received a rapidly increasing number of requests on CoDeeN, and consequently, the average response time for all requests slightly increases over time. However, the average response time for small files is steady and keeps decreasing. This result is not surprising, since we have focused on reducing failures rather than reducing success latency.