
Although the initial implementation of PAVM does very well compared to
other basic techniques, we can conserve even more energy using more
aggressive policies. In this section, we compare three versions of
PAVM: the initial implementation of PAVM, revision 1 that uses library
aggregation (PAVMr1), and revision 2 that also includes page migration
(PAVMr2). Both of the aggressive policies try to keep nodes in the Nap
mode longer, i.e., reducing
![]() in the second term of
Eq. (1), to realize significant additional energy savings.
in the second term of
Eq. (1), to realize significant additional energy savings.
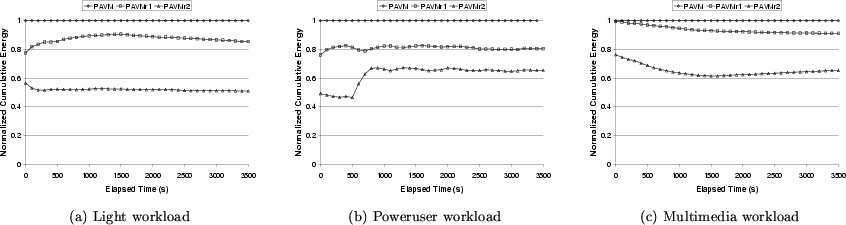 |
We repeat the set of workloads under PAVMr1 and PAVMr2 policies, and the resulting energy consumption is plotted in Figures 7(a-c), normalized to that of the initial PAVM implementation. PAVMr1 saves an additional 0-20% and PAVMr2 saves an additional 25-50% of the energy relative to the initial implementation. It is interesting to note the jump at the 10-minute mark in the Poweruser workload for PAVMr2. This is the point at which the periodic Linux kernel compilation first runs. Since kernel compilation creates many short-lived processes that start and complete between invocations of kmigrated, page migration does not help these processes, although it continues to be effective for the long-lived ones. Therefore, the benefit of page migration diminishes if short-lived processes dominate in the system.
The absolute average power dissipated for all of the power management techniques is summarized in Table 7. The Base system tends to draw close to a constant amount of power, since all nodes stay in Standby mode, with some small increases corresponding to the greater number of memory transactions in the Poweruser and Multimedia workloads. The energy savings realized vary greatly with the workload, and up to 94% reduction is seen with a lightly-loaded system. However, even with the very heavy Multimedia workload, 59% memory power reduction is realized.