|
| |||||||||||||||||||||||||||||||||||||||||||||||||||

| ||||||||||||||||||||||||||||||||||||||||||||||||||||
| Pp. 301–311 of the Proceedings |  |
Linux Scalability Project
Center for Information Technology Integration
University of Michigan, Ann Arbor
linux-scalability@citi.umich.edu
http://www.citi.umich.edu/projects/linux-scalability
|
|
The application-level memory allocator, or heap allocator, is a system API that must scale well with the number of application threads and the number of processors in the system. Known in UNIX as malloc(), the heap allocator makes use of several important system facilities, including mutex locking and virtual memory page allocation. Analyzing the performance of malloc() in a multithreaded and multi-CPU environment can provide important information about potential system inefficiency. Finding ways to improve the performance of malloc() can benefit the performance of any sophisticated multithreaded application, such as network servers.
Network servers make special demands that other types of applications may not make on memory allocators [5]. In this report we describe a simple malloc() micro-benchmark suite that drives multithreaded loads to test the ability of malloc() to divide its work efficiently among multiple threads and processors. The purpose of this suite is to determine the suitability of an operating system's heap allocator for use with network servers running in an SMP environment. We discuss initial results of the benchmarks, and show that malloc() performance is important to overall network server scalability.
The iPlanet directory server product is typical of many network server applications. It is a single multithreaded process that handles concurrent requests from many clients connected via TCP/IP. This software is often deployed on SMP hardware to take advantage of the potential scalability of multiple processors.
Using non-intrusive program counter sampling tools, iPlanet developers profiled a directory server running under several standard operating systems on four-processor machines. A typical workload in this environment causes classic lock contention symptoms when more than one processor is enabled, such as:
Further investigation indicated that the principle source of contention is the heap allocator. The directory server employs the operating system's per-process heap, which vendors often make thread-safe by adding a single lock to protect heap allocation logic.
Several alternative solutions were proposed.
The directory server development team prototyped and tested option 3. The performance improvement exceeded a factor of six on four-processor hardware. Subsequently a commercially developed heap allocator with enhancements to eliminate lock contention was integrated into the final version of the product.
To further this effort we have created a set of simple, portable benchmark programs to assess the scalability of an operating system's heap allocator as it interacts with low-level operating system facilities. We focus on simple benchmarks that treat each allocator as a black box, rather than use more complex trace-driven allocator simulations. Our tests are not meant to be scientific measurements of allocator performance, but rather to provide only an indication of relative acceptibility. In our experience, simple benchmarks can uncover basic architectural limitations that make an allocator inappropriate for use with network server applications. Furthermore, simple benchmarks are generally more portable.
Traditional analysis of heap allocators has focused on efficient use of space and minimal CPU overhead [7]. Our study instead tests three areas of heap allocator behavior related to good performance and scalability of multithreaded network servers on multiprocessor hardware:
As we add physical processors and threads, heap contention has direct impact on network server scalability. Our first benchmark starts several threads that request and free memory from the heap allocator. On multi-processor hardware, an ideal allocator would show linear speed-up for as many threads as there are processors in the system.
It is well known that synchonization primitives add significant overhead to lightweight algorithms such as heap allocators. Berger and Blumofe claim that a single lock added to the allocator can slow it down by as much as 50% on modern hardware [1].
Allocating memory in one thread and freeing the same object in a different thread can cause some heap allocators to abandon areas of memory. We'd like to measure how much normal allocator operation fragments the heap over time. This test specifically targets memory fragmentation caused by the allocator running in a multithreaded environment, rather than by pathological application behavior.
Note that this is not a traditional way to analyze malloc()'s heap fragmentation. Many implementers have focused on space efficiency; i.e. the ability of an allocator to provide the greatest number of allocated objects for a given amount of virtual address space. In fact, for network servers, it is acceptable to allow some space or time inefficiency in trade for other benefits, such as reduced heap fragmentation over time. This means a multithreaded network server can run for longer periods without exhausting its memory space due to orphaned memory.
Grunwald has shown the performance advantages of a cache-friendly allocator on modern SMP hardware [3]. In other words, the heap allocator can help reduce the effects of false cache line sharing and improve effective memory bandwidth by assigning object addresses with the specific characteristics of the CPU caches in mind. This is relevant to single processor hardware as well as SMP servers because modern CPUs rely more than ever on a memory hierarchy to bridge the gap between processor and memory speeds.
Careful placement of heap-allocated objects can also result in a lower application page fault rate. While the cost of cache misses has increased significantly as processor speeds outpace memory speeds, the impact of page faults on application performance has become even worse for similar reasons.
One of the most effective ways to reduce an application's page fault rate is to use a space-efficient heap allocator. However space-efficiency may not provide the highest cache-friendliness [4]. Another effective way to reduce page faults is to add more memory to the system. It is often more difficult to expand the size of CPU caches. Also, microprocessor cache designs are generally made less efficient (worse cache hit rate) by size and cost requirements. Cache-conscious libraries and application code offer one way to maximize the benefits of the CPU caches.
A heap allocator can employ two mechanisms to increase the effectiveness of the CPU caches and reduce false sharing that can cause wasted memory bandwidth on SMP hardware. First, a heap object shared among threads should never share a cache line with another heap object. Even small objects should reside in their own cache line, if practical. Wilson, and Johnstone et al., show that most modern allocators cause little real fragmentation beyond that caused by aligning objects to large address boundaries, so larger alignments may be a practical approach to reducing false sharing among CPU caches [7, 4].
Second, the allocator should take as much advantage of temporal locality as possible. Gunwald postulates that objects allocated at the same time tend to be used and then freed together [3]. We expect this behavior to be especially relevant for thread memory allocation.
Modern distributions of Linux use glibc version 2.0 and 2.1 as their C library. Glibc's implementors have adopted Gloger's ptmalloc as the glibc implementation of malloc() [2]. Ptmalloc has many desirable properties, including multiple heaps to reduce contention among threads sharing a single C library invocation.
Ptmalloc, based on Doug Lea's original implementation of malloc() [6], had several goals, including improved portability, space and time utilization, and added tunable parameters to control allocation behavior. Gloger's update to Lea's original retains these desirable behaviors, adds good multithreading behavior, and features several nice debugging extensions. The C library is built on most Linux distributions with debugging extensions and tunability disabled, so it is necessary to rebuild the C library or pre-load a separate version of malloc() in order to take advantage of these features. Alternatively, an application can invoke mallopt(3) to enable some of these features.
Ptmalloc maintains a linked list of subheaps. To reduce lock contention, ptmalloc searchs for the first unlocked subheap and grabs memory from it to fulfill a malloc() request. If ptmalloc doesn't find an unlocked heap, it creates a new one. This is a simple way to grow the number of subheaps as appropriate without adding complicated schemes for hashing on thread or processor ID, or maintaining workload statistics. However, there is no facility to shrink the subheap list and nothing stops the heap list from growing without bound. There are some (not infrequent) pathological cases where a producer thread allocates objects so often that it causes freeing threads to release objects into other subheaps, resulting in unbounded heap growth.
Ptmalloc makes use of both mmap() and sbrk() when allocating heap arenas. Malloc() uses sbrk() for allocation requests smaller than 32 pages, and mmap() for allocation requests larger than 32 pages. In general these system calls are essentially the same under the covers. Both use anonymous maps to provide large pageable areas of virtual memory to processes. Sbrk() can allocate only a fraction of the full virtual address space, however: sbrk() is not smart enough to allocate around pre-existing mappings, such as system libraries, that may appear in the middle of the address space. Later versions (post 2.1.3) of glibc have special logic to retry an arena allocation with mmap() if sbrk() fails. Kernel functions that use sbrk(), such as dynamic library loading, can also stop working if the application fills up its virtual address space.
Possible ways to help performance in this area include optimizing the allocation of anonymous maps and reducing and amortizing the overhead of these system calls by having malloc() allocate subheaps in larger chunks. We have already provided a version of sbrk() for the Linux kernel that removes acquisition of the global kernel lock in most paths (see mm/mmap.c in Linux kernel versions 2.3.5 through 2.3.7). This allows sbrk() to outperform mmap() of anonymous pages in the general case. In addition, making sbrk() work more flexibly when a process's virtual address space becomes fragmented improves malloc() performance for applications like network servers and large databases that allocate large quantities of small objects. Finally, improving the mechanism by which the kernel memory manager locates free areas in a process's virtual address space would provide significant benefits as address spaces become crowded with heap and text areas, and maps.
All benchmark programs are available on the project website.
We expect that, if a malloc() implementation is efficient, the two thread run will work as hard as the two process run. If it's not efficient, the two process run may perform well, but the two thread run will perform badly. Typically we've found that in a poorly performing implementation, a high context switch count as a result of contention for mutexes protecting the heap and other shared resources wastes a substantial amount of kernel time.
We are also interested in the behavior of malloc() and the system on which it's running as we increase the number of threads past the number of physical CPUs present in the system. Many researchers conjecture that the most efficient way to run heavily loaded servers is to keep the ratio of busy threads to physical CPUs as close to 1:1 as possible. We'd like to know the penalty as the ratio increases.
For each test, the benchmark makes 10 million balanced malloc() and free() requests, for the following reasons:
Our single thread benchmark starts by allocating a fixed number of objects from the heap, saving their addresses in an array. The array is passed to a freshly created thread, whose job is to replace a random subset of the originally allocated objects one at a time, create a new thread, then pass the array to it and exit. Each new thread is referred to as a "round." After each run completes we record the number of minor page faults, which is proportional to the number of pages required by the allocator during the benchmark run. Linux records a minor page fault for each page allocated with sbrk().
The multithread benchmark is much the same, except there are several threads concurrently replacing objects and creating new threads. In this way, threads obtain storage allocated in another thread, and must operate on this storage while the heap is under contention; these are the two conditions necessary to cause heap leakage. We observe this indirectly with the "minor page fault" statistic returned by the time command.
Notice that each thread replaces a single object at a time. This fixes the total amount of heap in use during a benchmark run between mn and m(n-1) objects, where m is the number of threads and n is the fixed number of pre-allocated objects. Now it is clear why we use a fixed instead of a randomly distributed object size. Because the benchmark fixes the total amount of heap storage in use at any given time, a perfect allocator should produce the same number of minor page faults for each run. Real allocators, however, show a wide variation in their final heap size because of heap leakage.
Cache behavior is difficult to measure. Other studies in this area often use trace-driven simulations and synthetic allocators to discover cache behavior [3]. This is because applications can use heap objects in a variety of ways, blurring the impact and causes of cache misses and page faults.
Our goal is to create a simple, portable benchmark that indicates whether cache ping-ponging may result from heap allocated objects shared between multiple threads. To test for false sharing, we allocate n k-sized objects, where n is a number less than or equal to the number of physical processors in the system, and k is a number close to the cache line size of the system's CPUs. We pass one allocated object to each of n threads. Each thread then writes into its object a fixed number of times. The thread writes at the front and the back of the object, in case the object overlaps cache lines. We then wait for all threads to finish, recording the elapsed time for all threads to complete. We run this test for increasing object sizes.
Note that this basic alignment test does not expose slow-downs due to cache ping-ponging of variables internal to malloc(), such as free list data structures or boundary tags.
The benchmark host for the following tests is a dual processor 200MHZ Pentium Pro with 128Mb of RAM and an Intel i440FX mainboard. The operating system is Red Hat's 5.1 Linux, which uses glibc 2.0.6 (note that glibc 2.0 and 2.1 use nearly identical versions of malloc()). We replaced the 5.1 distribution's kernel with kernel version 2.2.0-pre4. Gettimeofday()'s resolution on this hardware is 2-3 microseconds. During the tests, the machine was at run level 5, but was otherwise quiescent.
Our first test simply runs the benchmark five times in a single thread to show heap performance when it is not contended. On our hardware, ten million allocation and release requests for 512 bytes takes an average of 23.280357 seconds, with a standard deviation of 0.005543.
The next test compares the run times of two concurrent threads that share a heap with the run times of two concurrent processes that each has their own heap. Ideally both sets of runs should be the same on a dual processor machine. Each thread or process makes 10 million allocation and free requests for 512 bytes each. The averages reported in Table 1 are over three test runs.
| process 1, seconds | process 2, seconds | |
| Avg | 23.309635, s=0.014586 | 23.314431, s=0.014267 |
| thread 1, seconds | thread 2, seconds | |
| Avg | 26.040385, s=0.013097 | 26.063408, s=0.006530 |
TABLE 1. Average elapsed time for single heap per process versus multiple heaps per process. The two-threaded single heap test runs almost as fast as the two-process two-heap test, indicating acceptable heap contention. "s" is the standard deviation.
During this test, top showed that both threads were using between 98% and 99.9% of both CPUs. System (kernel) time was between 0.7% and 1.1% total.
We now examine the behavior of malloc() as we increase the number of working threads past the number of physical CPUs in the system. In this series of tests, each thread makes 10 million allocate/free requests for an 8192 byte object. Each reported average is taken over five benchmark runs.
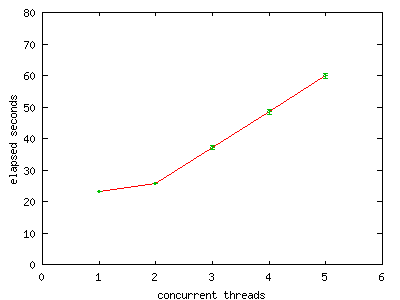
FIGURE 1. Elapsed run-time versus increasing thread count.
Run-time increases with the expected slope as thread
count increases, demonstrating acceptable heap contention on
this hardware. Error bars indicate standard deviation.
Figure 1 shows that average elapsed time increases linearly with the number of threads at a constant slope of m/n, where n is the number of processors (n = 2 in our case) and m is the number of seconds for a single thread run (m = 23 seconds in our case).
Lastly we measure the linearity of the relationship we discovered in the last tests over a much greater number of threads. This tells us how the library scales with increasing thread count. This table contains average elapsed time measurements (in seconds) for each thread making 10 million requests of 4100 bytes each.

FIGURE 2. Elapsed run-time with larger thread count.
On dual processor hardware, increasing thread counts have little
effect on heap contention.
Figure 2 illustrates that the increase in elapsed time is fairly linear with increasing thread count, for counts much larger than the number of configured physical CPUs on the system.
| thread 1, seconds | thread 2, seconds | |
| Avg | 54.272971, s=1.146125 | 54.407517, s=0.833170 |
| process 1, seconds | process 2, seconds | |
| Avg | 6.024991, s=0.018403 | 6.053607, s=0.054665 |
TABLE 2. Average elapsed time for single heap per process versus multiple heaps per process, Solaris. The shared single heap test is almost an order of magnitude worse than the test wusing separate heaps.
Here we observe massive heap contention. The two-thread run is almost an order of magnitude worse than the two-process run. While the Solaris heap allocator is the fastest single thread allocator (6 second runs on 400MHZ UltraSPARC II CPUs versus 10 second runs on 500MHZ Pentium III CPUs, described below), it clearly does not scale over multiple processors.
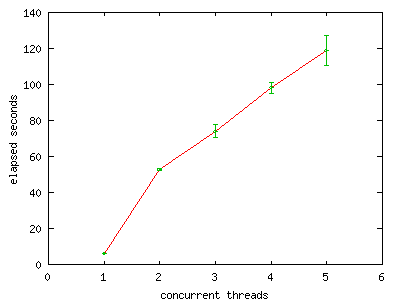
FIGURE 3. Elapsed run time versus increasing thread
count, Solaris.
The slope of this graph far exceeds the expected
slope of 6 seconds divided by 2 processors. Lock contention
is clearly a limiting factor when using a UP allocator
on SMP systems.
Running five threads concurrently on dual processor Sun hardware appears to be twenty times more expensive than running a single thread.
We observe in Table 3 that there is some added expense to using multiple threads instead of multiple processes, although it is about 20% on four processor hardware. While this could be improved, it is not as bad as an order of magnitude slowdown.
| thread 1, seconds | thread 2, seconds | |
| Avg | 12.393250, s=0.000422 | 12.397936, s=0.000432 |
| process 1, seconds | process 2, seconds | |
| Avg | 10.394361, s=0.000822 | 10.395771, s=0.000890 |
TABLE 3. Average elapsed time for single heap per process versus multiple heaps per process, 4-way Linux. More processors mean slightly more heap contention. Elapsed time for shared heap test is only 20% slower than for test using separate heaps.
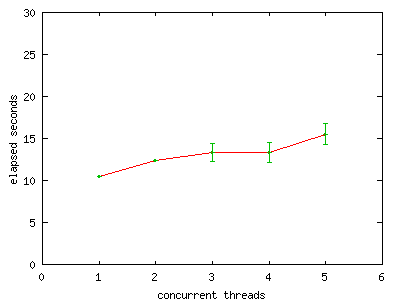
FIGURE 4. Elapsed run time versus increasing thread
count, 4-way Linux.
Scalability on 4 processor hardware is very good.
Notice that the average elapsed time jumps twice: once when going from one thread to multiple threads, and once when there are more threads than there are physical CPUs in the system.
| Run | Time in seconds |
| 1 | 12.587744 |
| 2 | 12.587753 |
| 3 | 14.862689 |
| 4 | 12.578893 |
| 5 | 12.577891 |
| 6 | 14.844941 |
| 7 | 12.579065 |
| 8 | 12.578305 |
| 9 | 14.841121 |
| 10 | 12.576630 |
| 11 | 12.577823 |
| 12 | 14.836253 |
| 13 | 12.584923 |
| 14 | 12.584535 |
| 15 | 14.856683 |
TABLE 4. Variance in elapsed run time, 4-way Linux. Note that most runs have a 12.6 second elapsed time. Only a few have elapsed time of about 14.8, pushing the average elapsed time higher. This variance is thought to be due to allocator variables that are improperly aligned with respect to hardware caches.
A closer examination of the raw data for the three-thread run, shown in Table 4, illustrates an interesting variance in the elapsed time results. Sometimes the threads complete in 12.6 seconds, and sometimes they run for about 14.8 seconds. We see similar variances in the runs with more threads. These are likely due to what Larson refers to as cache sloshing. When allocator variables, such as free list pointers or condition variables, are poorly placed in memory, they cause cache lines to bounce between CPU caches. In this test, this appears to cause sporadic 20% slowdowns in the runs. We explore this phenomenon further in the section describing benchmark 3.
We choose 40 bytes as our fixed request size. Other studies have shown that network servers use only a few object sizes, and they are in the neighborhood of 40 bytes [4, 5]. Our array contains 10,000 objects per thread. We vary the number of worker thread recreations (rounds) from 1 to 8. One round means the main thread starts worker threads that stop when they are finished. Two rounds mean the main thread creates worker threads, which, when they are finished, each create a new thread, which finish and stop, and so on.
Our first test runs a single thread while increasing the number of rounds in each run. This test demonstrates that, when there is no heap contention, memory utilization shows no variation as the memory objects are passed among threads. It also indicates how much memory is consumed by a single pthread_create() so we may subtract that from later benchmark runs.
Based on our single thread test results, we formulate a minimum page fault count predictor as follows. A single thread, single round run that allocates a one block array requires 14 page faults. Allocating 10,000 blocks per thread requires 127.6 pages (this is 40,000 bytes for each array, and 400,000 bytes for the objects themselves, plus a constant for memory management). Finally, each round requires an additional 1.1 pages per thread.

FIGURE 5. Number of rounds vs. number of minor page faults.
For our single thread run, each round (creation of another
thread) requires a single minor page fault over and
above heap management needs. Thus each
pthread_create() requires one extra page in the heap.
Our lower bound page fault count predictor becomes:
mpflower = 14 + 1.1tr + 127.6t
Where mpflower is the lower bound minor page fault count, t is the initial number of threads and r is the number of test rounds.
The next test increases the number of threads from one to three to see how multithreading changes the behavior of the allocator. As before, the test is run five times for each fixed round count. Average. ,minimum, and maximum minor page fault results are reported in Figure 6.
We predict page fault count to increase by three (one for each thread) for each additional test round. In fact, at the beginning of the series shown in Figure 6, the minimum page fault count for each run series starts at 399 and increases by 3 for each additional round, as predicted. However, large variances in the number of minor page faults and larger minimum page fault counts than predicted indicate that some heap leakage occurs as round count increases.
The relative difference between the minimum and maximum page fault count in each test ranges between 25% and 50% of the measured minimum page fault count. As the number of test rounds increases, this difference becomes less, suggesting that over time, bad allocator behavior is mitigated by statistical opportunity.
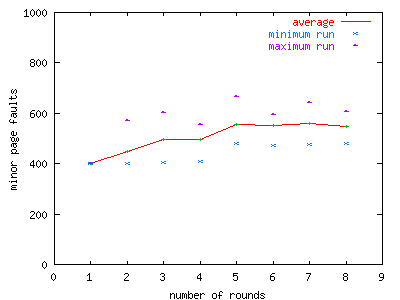
FIGURE 6. Number of rounds vs. number of minor page
faults, three thread run.
This run shows marked variances
resulting from heap leakage. Heap size grows faster than we
predicted based on what is consumed, per-thread, in the first
test series.
Our final uniprocessor test increases the thread count to seven. We want to see if increasing thread count causes larger variations or if they stay the same.
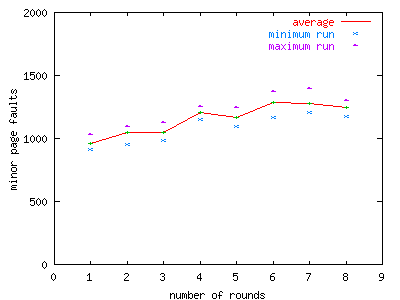
FIGURE 7. Number of rounds vs. number of minor page
faults, seven thread run.,
Inter-run heap size variations appear
to decrease with increasing thread count.
Figure 7 shows that while minimum page fault count is always larger than the predicted lower bound, the relative difference between minimum and maximum page fault counts is less in the seven thread run than in the three thread run, ranging from 9% to 18% of the minimum page fault count. This suggests that as workload increases (both thread concurrency and thread recycling) statistical behavior levels out imbalances between subheaps.
We try our seven thread run on an Intel SC450NX with 512Mb of RAM and four 500MHZ Xeon Pentium III CPUs with 512Kb of L2 cache each. We loaded this machine with the Red Hat 6.1 distribution, and upgraded it's kernel to 2.2.14. This test gives an indication of how heap behavior changes when there is real thread concurrency. We step up the number of rounds to force behavior that might expose itself after a server application has been running over a long period.

FIGURE 8. Number of rounds vs. number of minor page
faults, seven threads on four CPUs. The slope of the actual
page fault count follows our predictor function, so the allocator
is behaving reasonably well.
Even on a four processor server, malloc() on Linux appears to behave well. The minor page fault count averaged over five runs increases with approximately the same slope as our predictor function. The actual values are offset from the predicted values by nearly a constant. While there is some unpredictability in the amount of heap required for each test run, the heap doesn't appear to grow in an unbounded manner as the amount of heap activity increases.
Figure 9 compares the elapsed time of the benchmark against properly cache-aligned objects versus the same benchmark with arbitrarily aligned objects. Two threads compete with each other in this test. The test runs on object sizes between three and 52 bytes in order to vary the alignment of the objects with respect to hardware cache lines.

FIGURE 9. Cache sharing between two threads.
Cache line sharing results in twice the amount of elapsed time
per write operation. From this test, it is clear that heap
allocators that prevent cache line sharing can boost application
performance.
Here we clearly see that cache line sharing between two CPUs can cause a slow-down of more than half when the object is being concurrently modified. In other words, if two objects happen to overlap in a cache line, it can take more than twice as long for writes into each object to complete. Figure 10 shows the same test with the thread count increased from two to three. While each object's cache line is potentially shared between only two CPUs at a time, there is still a large penalty.
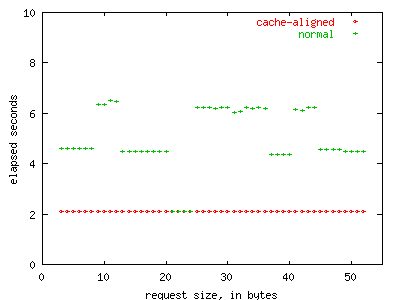
FIGURE 10. Cache sharing between three threads.
This test shows the impact of false cache sharing among three
processors due to improper heap object alignment.
Figure 11 depicts the same test with thread count increased from three to four.
Four threads modifying independent cache lines on this hardware can run almost as fast as a single thread. As soon as cache line sharing occurs, write performance is greatly reduced, sometimes by as much as a factor of four.
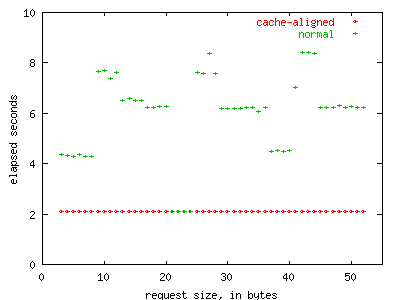
FIGURE 11. Cache sharing between four threads.
This test shows large elapsed time variances as well as substantial
slowdowns in write operations.
The precise results obtained in the tests that used normally aligned objects are not repeatable because the addresses of objects returned by malloc() are somewhat nondeterministic. However we observe that some of the time objects are aligned in such a way that false sharing occurs and application performance suffers.
While it is common wisdom that cache line sharing can affect application behavior, these tests demonstrate conclusively that this impact can be substantial. We note that this test artificially highlights alignment problems. Real applications will likely not be as profoundly affected by object misalignment.
Many allocators cause unbounded heap growth when an application allocates objects in one thread and releases them in another. Our benchmarks show that, even under contention, glibc's allocator becomes less efficient, but doesn't show pathological heap growth.
We also note potential slow-downs that can result from poor alignment of heap objects with respect to the Level 1 CPU cache line size. These slow-downs can be mitigated either by careful application design or by accepting a heap allocator that aligns objects automatically to cache line boundaries, and thereby increases heap fragmentation. Application developers might make use of two different allocation mechanisms: one for thread-private objects that provides tight alignment to reduce fragmentation and memory utilization, and one for objects that may be shared among threads that uses cache-aware alignment to reduce false cache sharing.
In the future, we plan to run tests that include two important areas not considered in this paper. Heap allocator latency should show little or no change as network servers remain up over time. We plan to create a benchmark to measure latency changes over server uptime. We also plan to test our assumptions about the allocation patterns of large-scale network servers by instrumenting heavily used servers to generate trace data.
Wilson, Zorn, and many others have spent considerable effort optimizing the basic algorithms for single threaded allocation. However, a close examination of the performance relationship between the C library's memory allocator and OS primitives such as mutexes, mmap(), and sbrk() might show some interesting trade-offs.
Finally, we plan to examine the performance and scalability of kernel-level memory allocators with these same criteria in mind. The kernel's slab allocator uses a single spin lock in each slab cache to control access among multiple threads. This has the same performance implications as using a single spin lock at the user level.
[2] W. Gloger, "Dynamic memory allocator implementations in Linux system libraries," www.dent.med.uni-muenchen.de/~wmglo/malloc-slides.html.
[3] D. Grunwald, B. Zorn, and R. Henderson, "Improving the Cache Locality of Memory Allocation," SIGPLAN Conference on Programming Language Design and Implementation, June 1993.
[4] M. S. Johnstone and P. R. Wilson, "The Memory Fragmentation Problem: Solved?" Proceedings of the First International Symposium on Memory Management, ACM Press, October 1998.
[5] P. A. Larson and M. Krishnan, "Memory Allocation for Long-Running Server Applications," Proceedings of the First International Symposium on Memory Management, ACM Press, October 1998.
[6] D. Lea, "A Memory Allocator," unix/mail, December 1996. See also g.oswego.edu/dl/html/malloc.html.
[7] P. Wilson, M. Johnstone, M. Neely and D. Boles, "Dynamic Storage Allocation: A Survey and Critical Review," Proceedings of the 1995 International Workshop on Memory Management, Springer LNCS, 1995.
[8] B. Zorn and D. Grunwald, "Empirical measurements of six allocation-intensive C programs," ACM SIGPLAN notices, 27(12): 71-80, 1992.
[9] B. Zorn and D. Grunwald, "Evaluating Models of Memory Allocation," ACM Transactions on Modeling and Computer Simulation, 4(1): 107-131, 1994.
|
This paper was originally published in the
Proceedings of the Freenix 2000 USENIX Annual Technical Conference,
June 18-23, 2000, San Diego, California, USA
Last changed: 9 April 2002 aw |
|