|
| |||||||||||||||||||||||||||||||||||||||||||||||||||

| ||||||||||||||||||||||||||||||||||||||||||||||||||||
|
LISA 2001 Paper
[LISA '01 Tech Program Index]
Gossips — System and Service MonitorAbstractGossips is a modular client/server based system monitor. It uses distributed monitoring tasks to define and report states of an IT- environment. A monitoring task includes probes to measure data and a test to evaluate them. Gossips does not only report problems, it can also suggest solutions to the problems by consulting a knowledge-base, which is maintained and easily extended by the system managers using the local system. The monitor software is easily extensible through a flexible plug-in system for tests and probes. The monitor software is written in object oriented Perl which allows new tasks to inherit large parts of the existing infrastructure of the program. IntroductionThe problem of monitoring a group of networked hosts has been discussed at length only recently by John Sellens [1]. Many protocols and tools for monitoring are available, including SNMP [2], Big Brother [3], Swatch [4], Spong [5] and pikt [6]. These have different strengths and weaknesses. Our goal in this project was to address some of the problems we found with existing solutions, focusing on a clean architecture and easy extensibility. After an evaluation of the mentioned tools we defined the following criteria for a new design:
State of the ArtEvaluation Criteria
ComparisonA first evaluation in summer 2000 showed deficiencies in most tools mainly in the areas of extensibility and modularity. The table in Figure 1 shows an updated summary of the evaluation based on the latest versions (September 2001) of the most promising monitor tools after our first evaluation. Big Brother
Swatch
Spong
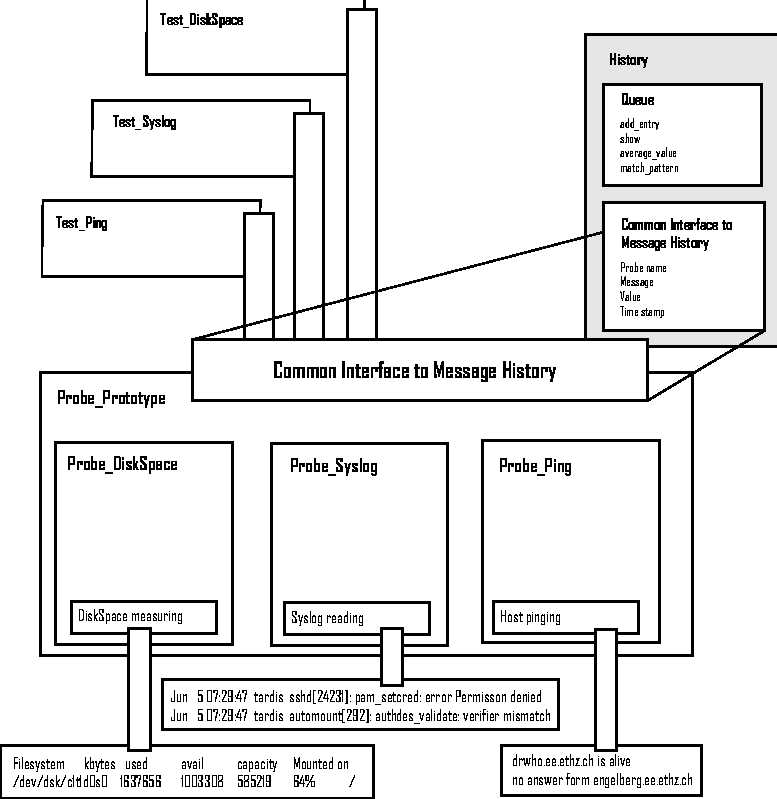
ResultsIn the process of evaluating the other products we found lots of fascinating concepts and ideas. But no tool had a really flexible framework for writing new tests. The framework we envisioned would handle all the basic functionality of a monitoring system like execution time, message handling and internal communication. Such a toolkit helps to implement new monitoring tasks much faster as the developer can focus on the functionality of the new monitoring task. We have not found a system which separates data acquisition and data analysis, allowing the implementation of reusable monitoring tasks. In the end no tool fulfilled our criteria to a degree which encouraged us to add the missing bits to an existing package, so we decided to implement the tool ourselves. Gossips DesignArchitectureGossips is a object oriented framework written in Perl. The software is designed as a distributed client/server architecture where all clients report to a central server. Gossips is configured through a central configuration file and controlled via a command-line interface. A message handling system on the server notifies the system manager about system-state-changes. This concept is similar to the messaging of cfengine [7]. Cfengine writes a message when it changes something on a system and gossips notifies the system manager if and only if a state-change occurs in the system. Thus there is no need for a graphical display of the system status, as most of the time nothing changes. For long-time monitoring of system status, a tool as for example RRDtool [8] can be used within the gossips frame work. (See Figure 9 for an example.) Probes and Tests - Separating Measurement from AnalysisEach participating client runs a gossips monitoring process. Each gossips process consists of a set of probe objects to acquire data about the state of the local system or anything else you want to observe. Data from these probes is then analyzed by a set of test objects. Each test can subscribe to any number of probes. This separation of data collection and data analysis was an important step toward simplifying the design, implementation and reuse of new monitoring components for the gossips system (see Figure 2). Gossips uses a scheduler similar to the one implemented in pikt. The scheduler manages the execution of all tests and probes within a gossips instance. It executes the probes periodically. When a probe finds new data it adds all tests which have subscribed to its data to the scheduler. When a test is executed, it accesses the data acquired by the probe together with a history of old data. The test evaluates the data and decides about the state of its target. States - Describing Systems or ServicesSimple Monitoring TasksThe generation of states relies on the data gathered by the probes. States describe the condition of a system or a service. It is up to the developer of a test to decide what states best describe a certain system. Simple things like working/broken are possible but also more complex approaches with many different states of operation. For example, if free disk space is monitored, a system manager needs to know when a certain threshold is reached. Additionally, it would be helpful to predict if a disk will fill up in the next hour. Because the test does not only see current data from a probe but also data collected earlier, it can make much more in-depth decisions as if it had only access to the latest measurements. This feature makes is possible to do trend analysis of measured values. In the free disk space-test just mentioned, all the data that was accumulated is used to calculate an approximate time when the disk fills up. The free disk space-test can then use the following states to decide the condition of a disk, all the values in this example are thresholds:
Combining Monitoring TasksBy assigning several probes to a test, a next level of defining states is reached. An ftp-test, for example, could just monitor an ftp connection to a host. It could use simple states like working or broken. The client monitor might also test the `pingability' of a host. When the observed host crashes or is rebooted gossips would then come up with two messages, one noticing the broken ftp connection and the other that the host is not alive. This is redundant information. The important information at this time is that the host is not alive. Therefore an ftp-test should be implemented that checks the ftp connection with an ftp-probe and simultaneously evaluates the `pingability' of a host using a ping-probe. The test is then able to access information on status messages of these two probes and use states like:
A test that subscribes to several numbers of probes allows very comprehensive state assessments. As each instance of gossips is able to decide about the state of the system it monitors, it will only talk to the central server if something interesting happens (a state- change). Because normal operation is much more common than problems, this approach helps to keep communication between clients and server down to a minimal level. ConfigurationCentral ConfigurationOne of the main design goals of the project was to keep the configuration files in one central location. Therefor gossips uses a central file for test parameters. Systems like Big Brother or Spong with their local config files for each client are much more cumbersome to change. If the parameters of a test must be edited for each client the system manager has to do lots of editing. With the complexity reducing group-design of gossips the system manager only has to edit some lines in the test.cfg file. Distribution of the ConfigurationAll instances of gossips get their configuration from a central configuration. When a gossips process on a client is started, it contacts the server and asks it for its configuration. The server can also push new configurations out to the clients as each client connects to the server in a regular interval to assure the server that it is still alive. host.cfgEvery host in the IT-environment is subscribed to groups. These groups describe hardware, network and organizational setup of a host. This design is similar to the class concept of cfengine. The difference between the two designs is that gossips uses a separate file to define a host-group relation whereas cfengine lets the host derive its memberships to the defined groups. This was made to be flexible enough to define abstract terms like department names, computer room names, institutes or even disk size as groups. See Figure 3 for an example of a host configuration file. test.cfgTests are configured by assigning parameters to groups. This allows to define a network wide configuration and also the specification of test parameters for a particular host. This is a similar approach as the configuration model of cfengine. For example every host is subscribed to a group called `ee', meaning it is located in the department of electrical engineering. All of these hosts receive the same test parameters when the parameters are assigned to the `ee' group. In Figure 4 part of a test configuration file is shown. Each test configuration section starts with its name encapsulated by three asterisks (***). Lines starting with `+' build a subsection to attach parameters to groups. *** HOSTS *** server server,ignore tardis ee,tardis,sun,2cpu,link,ignore engelberg ee,isg,sun,1cpu,ignore nova ee,isg,sun,2cpu,ignore jabba ee,jabba,sun,1cpu,ignore tardis-a4 ee,tardis-a,sun,1cpu,4gb,ignore *** Test_DiskS *** + ignore run = no + sun disk1 = scratch::100M::20min disk2 = tmp::100M::20min + sun&4gb disk = default::50M::30min *** Test_Load *** + ignore run = no + 2cpu period = 60sec timeavg = 30min proclim = 3proc + 1cpu run = no Gossips can also handle more complex group structures in the test configuration. By chaining several groups with `&' it is possible to assign very specific parameters to selected hosts. If parameters for a group `sun&4gb' are defined gossips would apply this configuration only for hosts belonging to both groups `sun' and `4gb'. Merging the Configuration InformationThe server process reads the configuration files and build an internal structure by merging the information. The merging algorithm searches in each test section of the config file shown in Figure 4 for a matching constellation with a host by seeking from the bottom to the top. On the top of every test section is a group called `ignore'. It has the parameter `run = no' which deactivates the test for a group. As you can see in Figure 3 all hosts are member of the `ignore' group. If the merging algorithm finds for a host no other match than the `ignore' group, the test is deactivated for the host. If no match can be found at all, meaning, a host is not a member in the `ignore' group, gossips will tell the system manager to review his configuration files. Based on the information available in the configuration file fragments shown in Figures 3 and 4 the host `tardis-a4' would receive the configuration shown in Figure 5.
tardis-a4:
     Test_DiskS: sun&4gb
             default::50M::30min
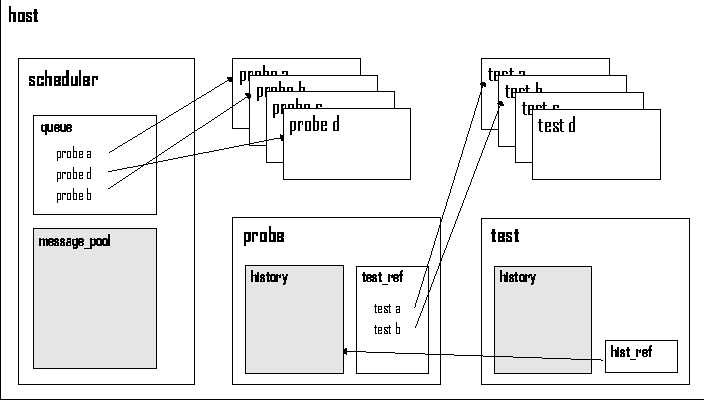 The Knowledge BaseOne of the functions of the gossips server is to provide a message handling system which notifies the system manager of state-changes found by tests running on the clients. Because gossips reacts to state-changes and not to system conditions it will only report a broken disk once. If the disk breaks, this is a state-change, and gossips will report it. The disk will only be reported again when the state of the disk changes (e.g., miracle healing). Depending on the nature of the state-change, the solution to the problem might not be obvious. When a problem occurs for the first time, there is no helping it, someone has to get to the bottom of the problem and find a solution. Once the solution is found, gossips allows to attach a description of the solution to the original message. Gossips stores this information in its knowledge base. When this particular state-change occurs again, gossips will not only inform the system manager about the new state, but will also tell about the solution which was found last time. It is possible that in some cases many different causes will result in the same state-change. Lets look at a hard drive which is running out of space. When this happens for the first time, the system manager will add a description of the problem to the knowledge base. If the state-change occurs again at a later stage and the system manager finds a different cause for the problem, the knowledge base entry can easily be edited to explain the second possible cause as well. Otherwise the trigger can be adjusted to match the state-change more closely. If the system manager notices that a certain problem occurs again and again, gossips could be used together with cfengine, which is able to do reparations or rebuild configurations. Message Handling SystemGossips does not maintain a fancy web page with red and green icons indicating the system health. Normally it is quiet and leaves the system manager alone. Only if a problem occurs gossips searches its knowledge base and initiates a message to the system manager about the new state of the system or service. The communication module at the moment uses email, but it can easily be extended to talk over other transports, e.g., a pager. Visual monitoring tasks can be implemented for long-time monitoring by using RRDTool as graphic library (see Figure 9). Implementation of GossipsStartup of a ProcessLet's start at the beginning and see what happens when you start the monitoring system. A gossips distribution contains two shell scripts which are designed to be executed as init.d scripts. The startup scripts gossips-client-control and gossips- server-control will each start the related process as daemons. Both scripts handle the command-line arguments start, stop and restart. 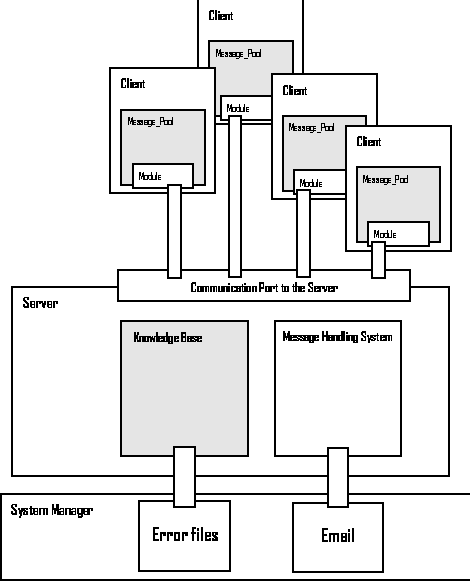 Internal Organization of a Gossips ProcessServer and Client ModulesThere is a single main gossips program. By using different startup parameters it loads either the server or the client modules. Every gossips process has the same objects, a scheduler, as well as several probe- and test-objects. In Figure 6 the internal structure of a host is illustrated. The next subsection will describe the function of each object. Objects in a Gossips InstanceThe scheduler object manages the internal operation of a gossips process. It uses a queue to control the firetime of probes and tests. Every probe object consists of a period. When a probe has finished its execution the scheduler puts it back into the queue and it will be re-executed after the specified time interval. Every object in a gossips instance has a history object attached. The history object of the scheduler is called message_pool. To save the states of the related object the history uses a stack of constant length. In addition, the history supplies methods to evaluate its contents. For example, it provides a trend analyzing method which calculates a gradient of the numerical values stored in the history. The probe objects gather the data for the monitor system. The data is stored in the attached history and accessible for the test objects through a reference. The test objects which evaluate the measured data are referenced in the probe object. At the end of its execution the probe inserts all the test objects that are subscribed to it into the scheduler queue. If a test is already scheduled it will not be added to the queue again. Client/Server CommunicationThe gossips client/server architecture is implemented with probes and tests. The client and the server both use modules to communicate with each other. Each module uses a probe and a test object to implement its functionality. In Figure 7 the client/server architecture and the relation to the system manager is shown. When a test on a client detects a new state, it pushes the related message into the message pool of the scheduler. A probe monitors the message pool. If a new message is put in the message pool the probe schedules a test that connects to the server and forwards all new messages from the message pool to the server.
On the server a probe listens for client connections. The client authenticates itself using a challenge/respond-module. The communication socket itself is not encrypted by default, but it is possible to modify the client/server-modules to use the IO-Socket- SSL-perl-module which provides SSL functionality. Current Gossips DistributionThe current gossips distribution is not just a monitoring toolkit. The current release of the package consists of an installation system, the gossips base classes, several monitoring tasks, and full documentation. Figure 8 shows a listing of the currently implemented monitoring tasks. ExtendingBase ClassesOne of the main reasons for designing gossips as an object oriented framework was to define a clear and simple interface for adding new tests and probes. Gossips comes with base classes for tests and probes including several methods. The base classes provide all the communication infrastructure required for tests and probes. They also handle the scheduler as well as a few other essential gossips services. The first step to build a new monitoring task is to separate data collection from data evaluation. Data collection is done with the probe object that measures a device or a service. The evaluation of the collected data is done by the test object. Both objects are instances of a basic test and a probe class. Adding ProbesProbes often use UNIX-commands to collect data. Gossips supports the execution of external commands through a method called `safe_run' which kills any started process if it does not complete within a given amount of time. The main method of a probe object is the `my_script'-method. It must be overridden when inheriting from the basic probe class. The job of the scheduler is to execute the `my_script'-method. (See Figure 10 for an example of a method that pings hosts.) Adding TestsIt is a bit more complex to implement a new test class. Again the main method that is called by the scheduler is named `my_script.' Additionally, a method must be added that defines a language to parse the desired parameters from the configuration file and one that links these parameters with the probes and the test. Those two methods are explained in the next section. The new test object will determine a certain state from the data acquired by the probe. This state is the return value of the main method `my_script' (see Figure 11 for an example of a method evaluating ping measurements). In this example the `my_script' method uses a pattern analyzing feature of the history object. This method only returns the first message of the history if it was repeated at least twice in a row. This feature forces the test to verify a received probe message. The state is only returned when it was confirmed once again. This test directly uses the returned messages of the ping command as states. The ping command of a Solaris distribution returns messages like hostname is alive, no answer from hostname or ping: unknown host hostname. On a Linux system the `my_script' method would be implemented differently.
sub my_script {
  my $self = shift;
  my $history = shift;
  my $message = $history->show_message();
  return $history->first_entries_eq(1);
}
The history object provides several methods to handle the collected data of the probe. It has methods to show the content of history entries. A history entry contains the name of the owner object, a message field, a value field and a time-stamp. Value fields could, for example, store available disk space in a test monitoring a hard disk. 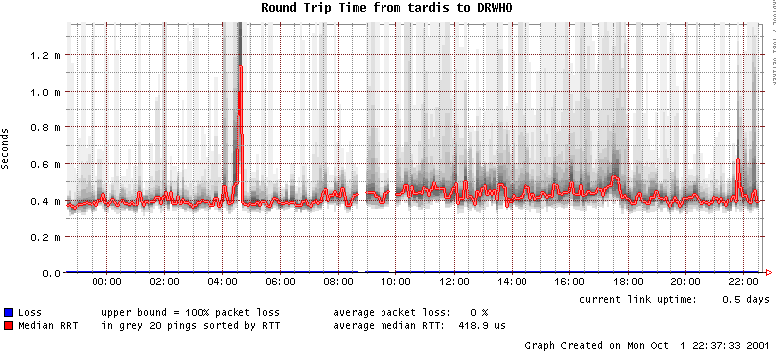
sub my_script {
  my $self = shift;
  my $target = $self->argument;
  my $message = $self->safe_run("/usr/sbin/ping $target 5");
  return $message;
}
The history also provides methods that evaluate its value fields. One example is an average-method that calculates the arithmetic mean of all values in the history entries. The history provides the gradient-method to be able to predict trends of measured values. This method calculates a gradient using the values from the history entries along with its time-stamp. The result of the `my_script'-method is the identified state of the measured service. Gossips then decides if the result is a state-change. If it is, gossips puts the state message into the message pool of the scheduler object. Defining the ConfigurationThe configuration system of gossips gives the test developer the freedom to define his own `parameter style.' Two methods are required in the test module to define the syntax of the parameter and the assignment of parameters to the test and the probes. A `my_syntax'-method defines the syntax of the test parameters in the configuration file seen in Figure 4. Figure 12 shows the corresponding `my_syntax'-method of the `Test_Load'-class.
To assign the different parameters to the test and probes the developer has to implement a `my_struct'-method. Again, the test base class offers methods to define these relations.
sub my_syntax {
    my $self = shift;
[1] $self->add_syntax_key('run');
[2] $self->add_syntax_to_key('run','/^no$/',"wrong 'run' value");
[3] $self->add_syntax_key('period');
[4] $self->add_syntax_to_key('period','/^\d+sec$/',
                             "syntax error in 'period' parameter");
    $self->add_syntax_key('timeavg');
    $self->add_syntax_to_key('timeavg','/^\d+min$/',
                             "syntax error in 'time average' parameter");
    $self->add_syntax_key('proclim');
    $self->add_syntax_to_key('proclim','/^\d+\e.?\ed*proc$/',
                             "syntax error in 'proc limit' parameter");
}
sub my_struct {
    my $self = shift;
[A] $self->add_key_to_struct('period');
[B] $self->add_filter_to_parameter('period','/^(\d+)sec/',1);
[C] $self->add_key_to_struct('timeavg');
[D] $self->add_filter_to_parameter('timeavg','/^(\d+)min/',1);
    $self->add_key_to_struct('proclim');
    $self->add_filter_to_parameter('proclim','/^(\d+)proc/',1);
[E] $self->add_probe_to_struct('Probe_Load');
[F] $self->link_key_elem_to_probe_period('period',1,'Probe_Load');
[G] $self->link_key_elem_to_test('timeavg',1);
[H] $self->link_key_elem_to_test('proclim',1);
}
In the `my_struct'-method of the `Test_ Load'- class seen in Figure 13 the developer first adds the keys defined in the configuration file.
Figure 14 illustrates the relations between the configuration parameter, the parser, the test and the probe object. Defining the StatesThe generation of states relies on the data gathered by the probes. For a simple test like a ping test the collected data already defines reasonable states like `host is alive' or `no answer from host.' In more difficult cases the test developer has to define his own set of states in the test class. The main job of the `my_script'-method in the test module is to handle the messages in the history of the probe. The message should be mapped to logical states. The definition of a sensible set of states is essential for successful monitoring. The type of information that flows from the history into the states is restricted in some points. Remember that gossips supplies state- changes. States should express if they are good or bad. By using such states gossips is able to tell the system manager if a monitored service just changed to a bad state. If gossips monitors, for example, a hard disk by collecting the free disk space it should use a threshold value. With such a value it can define states like `Everything okay with disk /scratch' when the free disk space is larger then the threshold or `less than 100 M on disk /scratch' if the free disk space shrinks under the defined mark of 100 MB. The important point for the design of states is that they should not contain changing elements like actual disksize, uptimes, etc. Otherwise gossips will generate lots of state- change messages overwhelming the system manger. Gossips provides the possibility to log changing values like `free disk space.' These values can be submitted to the server along with the state message. The server then stores these values in a logfile associated with the corresponding knowledge base file. 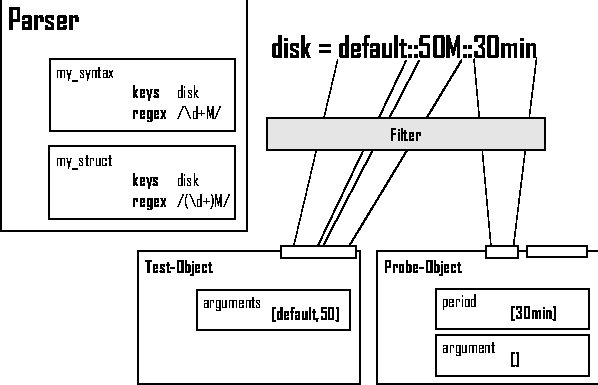 ConclusionsThe distributed architecture of gossips builds a scalable monitoring system. Through its flexible and central configuration environment, together with its command-line module, gossips is easily maintainable. The object oriented design of gossips builds a flexible and well defined framework for developing new monitoring tasks. The concept of separating data acquisition and data analysis makes defined monitoring tasks reusable and provides the possibility to build combined tests. The knowledge base allows to archive solutions to known problems in one place and to integrate the knowledge of the system manager. By including cfengine, gossips could be extended into a automated repair tool. Development of an SNMP-probe-class would extend the monitor software to a low level device monitor. AvailabilityGossips source and documentation along with its monitoring tests are available on the web-page https://isg.ee.ethz.ch/tools. There is a mailing list on gossips. Send an email with subject: subscribe to gossips-request@list.ee.ethz.ch to subscribe. AcknowledgmentsWe would like to thank the following people for their feedback and suggestions: our co-workers Andreas Karrer, David Schweikert, Edwin Thaler, Christoph Wicki, Fritz Zaucker, as well as our shepherds Mark Burgess and Todd K. Watson. Author InformationVictor Götsch is a third year Computer Science student at the Swiss Federal Institute of Technology, Zurich. After finishing his second year he started an internship with the IT Support Group of the Department of Electrical Engineering where he learned a lot about system management and spent most of his time developing the System and Service Monitor gossips. He will continue his studies in fall 2001 to get his degree in Computer Science. Albert Wuersch got a degree in Electrical Engineering from the Swiss Federal Institute of Technology in 1999. He worked for nine months as a Trainee System Manager for the IT Support Group of the EE Department. During that time he designed the gossips concept and started the implementation. Tobias Oetiker is a Senior System Manager with the above mentioned IT Support Group and has guided the gossips project over the last 18 months. References[1] Sellens, John, ``System and Network Monitoring,'' ;login:, Vol 25, No. 3, June, 2000.[2] Case, Fedor, Schoffstall, and Davin, ``A Simple Network Management Protocol (SNMP),'' RFC 1157, SNMP, May, 1990. [3] MacGuire, Sean, ``Big Brother, a tool for proactive network monitoring,'' https://www.bb4.com. [4] Hansen, S. E., E. T. Atkins, ``Automated System Monitoring and Notification With Swatch,'' Proceedings of the Seventh Systems Administration Conference (LISA VII), p. 145, USENIX Association, Berkeley, CA. [5] Johnson, Stephen L., ``Spong - Systems and Network Montoring,'' https://spong.sourceforge. net. [6] Osterlund, R., ``PIKT: Problem Informant/Killer tool, Proceedings of the Fourteenth Systems Administration Conference (LISA XIV), p. 147, USENIX Association, Berkeley, CA. [7] Burgess, Mark, ``Cfengine: A Site Configuration Engine,'' USENIX Computing Systems, https://www.iu.hio.no/cfengine, Vol 8, No. 3, 1995, [8] Oetiker, Tobias, ``RRDTool, The Round Robin Database Tool for Long Time Monitoring,'' https://people.ee.ethz.ch/~oetiker/webtools/rrdtool. | ||||||||||||||||||||||||||||||||||||||||||||||||||||||||||||||||||||||||||||||||
|
This paper was originally published in the
Proceedings of the LISA 2001 15th System Administration Conference, December 2-7, 2001, San Diego, California, USA.
Last changed: 2 Jan. 2002 ml |
|