15th USENIX Security Symposium
Pp. 93–104 of the Proceedings
Milk or Wine: Does Software Security Improve with Age?
1
2
Andy Ozment
MIT Lincoln Laboratory3
Stuart E. Schechter
MIT Lincoln Laboratory
Abstract
We examine the code base of the OpenBSD operating system to determine whether its security is increasing over time. We measure the rate at which new code has been introduced and the rate at which vulnerabilities have been reported over the last 7.5 years and fifteen versions.
We learn that 61% of the lines of code in today's OpenBSD are foundational: they were introduced prior to the release of the initial version we studied and have not been altered since. We also learn that 62% of reported vulnerabilities were present when the study began and can also be considered to be foundational.
We find strong statistical evidence of a decrease in the rate at which foundational vulnerabilities are being reported. However, this decrease is anything but brisk: foundational vulnerabilities have a median lifetime of at least 2.6 years.
Finally, we examined the density of vulnerabilities in the code that was altered/introduced in each version. The densities ranged from 0 to 0.033 vulnerabilities reported per thousand lines of code. These densities will increase as more vulnerabilities are reported.
1 Introduction
Many in the security research community have criticized both the insecurity of software products and developers' perceived inattention to security. However, we have lacked quantitative evidence that such attention can improve a product's security over time. Seeking such evidence, we asked whether efforts by the OpenBSD development team to secure their product have decreased the rate at which vulnerabilities are reported.
In particular, we are interested in responding to the work of Eric Rescorla [11]. He used data from ICAT4 to argue that the rate at which vulnerabilities are reported has not decreased with time; however, limitations in the data he used prompted us to investigate this area further.
We chose OpenBSD version 2.3 as our foundation version, and we collected 7.5 years of data on the vulnerabilities reported in OpenBSD since that version's release.
In particular, we focused our analysis on foundational vulnerabilities: those introduced prior to the release of the foundation version. We also analyzed the evolution of the code base. We were driven by the goal of answering the following questions:
-
How much does legacy code influence security today?
- Do larger code changes have more vulnerabilities?
- Do today's coders introduce fewer vulnerabilities per line of code?
- What is the median lifetime of a vulnerability?
Most importantly:
-
Has there been a decline in the rate at which foundational vulnerabilities in OpenBSD are reported?
In the upcoming section, we discuss the limitations of vulnerability reporting data; these limitations may result in our analysis underestimating increases in the security of OpenBSD.
In Section 3, we elaborate on the methodology used to collect the data sets employed in this work. We then describe the results of our source code and vulnerability density analysis in Section 4. In Section 5 we provide statistical evidence that the rate at which foundational vulnerabilities are reported is decreasing. Finally, we discuss related literature in Section 6 and conclude in Section 7.
2 Limitations of vulnerability analyses
Our analysis uses the rate of vulnerability reports to measure one characteristic of OpenBSD's security. We use this data to estimate the size of the remaining pool of unreported vulnerabilities and to estimate the expected frequency with which new vulnerabilities will be reported. However, this information is only one aspect of the security of OpenBSD. The OpenBSD development team has not only worked to increase the security of the system's code base; they have also worked to improve its overall security architecture. These improvements include new security functionality and safeguards that reduce the severity of vulnerabilities.
2.1 New security functionality
The addition of valuable new security functionality, like OpenSSH, increases the amount of code that is deemed security-critical and may thus increase the pool of reportable vulnerabilities. This increase does not necessarily imply that the code is less secure: it may only mean that the operating system has assumed new security responsibilities.
2.2 Reductions in vulnerability severity
Architectural improvements that reduce the severity of a vulnerability---but do not eliminate it entirely---can improve security without reducing the rate at which vulnerabilities are discovered and reported. For example, the OpenBSD team improved the security architecture of OpenBSD by adding stack-guarding tools and randomized memory allocation [4], both of which reduce the severity of vulnerabilities within the code base.
These security improvements are not accounted for in our study, because we lack an accurate and unbiased methodology with which to assess the severity of vulnerabilities.
Simply measuring reductions in the total pool of vulnerabilities is thus likely to underestimate improvements to the security of the overall system.
2.3 The influence of effort & skill on vulnerability discovery
The rate at which vulnerabilities are discovered and reported depends on the level of effort being expended to do so. To measure how much more difficult it has become to find vulnerabilities over time, we would need to normalize the rate of discovery by the effort being exerted and the skills of those exerting it.
Unfortunately, vulnerability reports do not include estimates of how many individuals were involved in examining the software, the time they spent, or their relative skills.
| Version in which the vulnerability was born |
|
|
2.3 |
2.4 |
2.5 |
2.6 |
2.7 |
2.8 |
2.9 |
3.0 |
3.1 |
3.2 |
3.3 |
3.4 |
3.5 |
3.6 |
3.7 |
Total |

|
2.3 |
5 |
|
|
|
|
|
|
|
|
|
|
|
|
|
|
5 |
| 2.4 |
11 |
0 |
|
|
|
|
|
|
|
|
|
|
|
|
|
11 |
| 2.5 |
6 |
0 |
1 |
|
|
|
|
|
|
|
|
|
|
|
|
7 |
| 2.6 |
5 |
1 |
0 |
0 |
|
|
|
|
|
|
|
|
|
|
|
6 |
| 2.7 |
12 |
4 |
2 |
2 |
2 |
|
|
|
|
|
|
|
|
|
|
22 |
| 2.8 |
12 |
1 |
0 |
1 |
2 |
0 |
|
|
|
|
|
|
|
|
|
16 |
| 2.9 |
4 |
0 |
0 |
2 |
0 |
0 |
0 |
|
|
|
|
|
|
|
|
6 |
| 3.0 |
3 |
1 |
0 |
0 |
1 |
0 |
2 |
0 |
|
|
|
|
|
|
|
7 |
| 3.1 |
8 |
2 |
1 |
2 |
0 |
0 |
0 |
1 |
1 |
|
|
|
|
|
|
15 |
| 3.2 |
6 |
2 |
0 |
0 |
0 |
0 |
1 |
2 |
0 |
1 |
|
|
|
|
|
12 |
| 3.3 |
2 |
1 |
0 |
2 |
0 |
0 |
0 |
0 |
0 |
0 |
2 |
|
|
|
|
7 |
| 3.4 |
2 |
0 |
0 |
0 |
1 |
0 |
1 |
0 |
1 |
0 |
0 |
0 |
|
|
|
5 |
| 3.5 |
7 |
1 |
1 |
0 |
0 |
0 |
0 |
2 |
0 |
1 |
0 |
0 |
1 |
|
|
13 |
| 3.6 |
3 |
0 |
1 |
0 |
0 |
0 |
0 |
0 |
0 |
0 |
0 |
0 |
0 |
0 |
|
4 |
| 3.7 |
1 |
1 |
0 |
0 |
1 |
0 |
0 |
0 |
0 |
0 |
0 |
0 |
1 |
0 |
0 |
4 |
| Total |
87 |
14 |
6 |
9 |
7 |
0 |
4 |
5 |
2 |
2 |
2 |
0 |
2 |
0 |
0 |
140 |
| MLOC |
10.1 |
0.4 |
0.3 |
1.1 |
0.8 |
0.4 |
2.2 |
0.6 |
0.8 |
0.3 |
0.3 |
0.8 |
1.4 |
0.7 |
0.9 |
| |
Table 1: The OpenBSD version in which vulnerabilities were introduced into the source code (born) and the version in which they were repaired (died). The final row, at the very bottom of the table, shows the count in millions of lines of code altered/introduced in that version.
3 Methodology
We chose to study OpenBSD because its developers have long prioritized security [8]. In his work, Rescorla found no convincing evidence for a decrease in the rate of vulnerability reporting for three operating systems: Windows NT 4.0, Solaris 2.5.1, and FreeBSD 4.0 [11]. He did find a decrease in the reporting rate for RedHat 6.2, but he notes the existence of confounding factors for that system. We therefore sought to test a system whose developers focused on finding and removing vulnerabilities: if we had replicated Rescorla's results with this system, then less security-focused systems would presumably have the same results. Another reason that we selected OpenBSD is that its entire source code and every change that has been made to it are readily accessible via a publicly accessible CVS repository.
The initial release of OpenBSD was version 2.0; this version was forked from NetBSD 1.1 in late 1996. Prior to version 2.2, the OpenBSD developers performed an extensive security audit and repaired numerous vulnerabilities without reporting them. In version 2.3, the OpenBSD team changed the way they integrated X11 into the code base. We therefore selected version 2.3, released on 19 May 1998, as the earliest version for our data set: it was the first truly stable release in which vulnerabilities were consistently documented. We refer to this version as the foundation version, and we refer to code and vulnerabilities present before the release of this version as foundational code and foundational vulnerabilities.
The OpenBSD project releases a new version approximately every six months, incrementing the version number by 0.1. Our study incorporates the fifteen versions of OpenBSD from 2.3 to 3.7, inclusive.
3.1 The vulnerability data set
The OpenBSD vulnerability data set was created through the following process:
-
We compiled a database of vulnerabilities identified in the 7.5 years between 19 May 1998 and 17 November 2005 by merging data from the OpenBSD security web page and four public vulnerability databases: NVD (formerly ICAT), Bugtraq, OSVDB, and ISS X-Force.
- We examined CVS records and the source code to identify the date on which the vulnerability was repaired. If the fix was itself faulty, the date of the first repair effort is used because it most closely tracks the date of discovery. We then selected the earliest of two possible dates for the vulnerability's death: the date on which the vulnerability was reported or the date of the first repair.5
- We manually examined prior versions of the source code to identify the date on which the vulnerability was introduced. If there was any doubt, the earliest possible date was chosen. A vulnerability is born on the date that the first version of OpenBSD to include the vulnerable code is released.
Not all vulnerabilities could be easily and precisely categorized: the process was manual, time-consuming, and laborious. In particular, we had to make a number of decisions about inclusion and uniqueness.
We included vulnerabilities that we believed to be applicable to the bulk of OpenBSD's installed base. We excluded vulnerabilities that were specific to processor architectures other than the x86. We also excluded vulnerabilities that were location/country dependent. In addition, we excluded reports of vulnerabilities in historical versions of OpenBSD if the release that was current at the time of the report was not vulnerable.
Our analysis covers all portions of the OpenBSD code in the primary CVS repository. This includes the X-windowing system, the Apache web server, and many additional services not traditionally considered to be part of the core operating system. However, this repository excludes the `ports' collection of third-party software that is not officially part of OpenBSD. We included vulnerabilities regardless of whether or not they applied to the default configuration of OpenBSD.
Some of the reports in these vulnerability databases do not fit the traditional definition of a vulnerability: a few might be better described as reports of proactive efforts to improve security design. However, we did not exclude any vulnerability reports based on justification or severity, as we lacked an unbiased methodology with which to assess these factors.
The most difficult distinction for us to make was whether a group of related reports should be treated as independent vulnerabilities or a single vulnerability. Individuals may find and report multiple related vulnerabilities at once: either by discovering a new class of vulnerability, a new mechanism for identifying vulnerabilities, or a section of poorly written code. Often these related vulnerabilities are remediated in the same patch. In order to maintain the independence of each data point, we grouped closely-related vulnerabilities that were identified within a few days of each other into a single vulnerability data point. A discussion of the need for independent data points---and a more detailed explanation of how vulnerabilities were characterized in this data set---is described in earlier work [10].
Similarly, OpenBSD includes some software that is maintained by third parties (e.g. sendmail). Those third parties often release new versions of their software that bundle together fixes for multiple (previously secret) security flaws. Unfortunately, the third party producers do not always make available the information necessary to identify the birth and death date of the component vulnerabilities. As a result, every such `bundle' patch was counted as a single vulnerability and was assigned the birth date of the youngest identifiable security flaw included in the bundle. Our decision to bundle vulnerabilities is a result of our inability to obtain access to the data necessary to differentiate between them. However, it may result in an inflated perception of security for the system: the models will process fewer vulnerabilities and thus may find a more rapid trend towards depletion.
3.2 Vulnerability births and deaths
Table 1 shows the number of vulnerabilities that were born and died in each version of OpenBSD. The version in which the vulnerability was born is specified by the column. The version in which the vulnerability died is specified by the row. The first column contains a total of 87 vulnerabilities that are foundational: they were introduced before the start of our study and were thus present in the code of the foundation version, 2.3. The top entry in that column indicates that 5 vulnerabilities died during the six months between the release of version 2.3 and the release of 2.4.
The bottom row of Table 1 also shows the number of lines of code, in millions, that were altered/introduced in each release (see Section 3.3 for the methodology used to obtain this information).
|
3.7 |
|
|
|
|
|
|
|
|
|
|
|
|
|
|
4 |
| 3.6 |
|
|
|
|
|
|
|
|
|
|
|
|
|
3 |
3 |
| 3.5 |
|
|
|
|
|
|
|
|
|
|
|
|
7 |
6 |
6 |
| 3.4 |
|
|
|
|
|
|
|
|
|
|
|
4 |
4 |
3 |
3 |
| 3.3 |
|
|
|
|
|
|
|
|
|
|
2 |
2 |
1 |
1 |
1 |
| 3.2 |
|
|
|
|
|
|
|
|
|
2 |
1 |
2 |
1 |
1 |
1 |
| 3.1 |
|
|
|
|
|
|
|
|
5 |
5 |
5 |
4 |
3 |
3 |
1 |
| 3.0 |
|
|
|
|
|
|
|
4 |
3 |
3 |
3 |
2 |
2 |
2 |
2 |
| 2.9 |
|
|
|
|
|
|
14 |
13 |
12 |
11 |
11 |
10 |
8 |
8 |
7 |
| 2.8 |
|
|
|
|
|
3 |
2 |
3 |
2 |
2 |
2 |
2 |
2 |
1 |
1 |
| 2.7 |
|
|
|
|
6 |
6 |
4 |
4 |
3 |
3 |
3 |
2 |
2 |
2 |
2 |
| 2.6 |
|
|
|
9 |
9 |
9 |
7 |
6 |
6 |
6 |
6 |
5 |
5 |
5 |
5 |
| 2.5 |
|
|
3 |
2 |
2 |
2 |
1 |
1 |
1 |
1 |
1 |
1 |
1 |
1 |
1 |
| 2.4 |
|
4 |
4 |
3 |
3 |
3 |
2 |
2 |
2 |
2 |
2 |
1 |
1 |
1 |
1 |
| 2.3 |
100 |
96 |
94 |
86 |
79 |
77 |
70 |
67 |
66 |
66 |
65 |
64 |
62 |
61 |
61 |
|
|
2.3 |
2.4 |
2.5 |
2.6 |
2.7 |
2.8 |
2.9 |
3.0 |
3.1 |
3.2 |
3.3 |
3.4 |
3.5 |
3.6 |
3.7 |
| |
Composite version |
Table 2: The percentage of each version of OpenBSD that is composed from earlier versions. Columns represent composite versions of OpenBSD, whereas rows represent the source versions of OpenBSD from which they are composed. Each value in the table is the percentage of lines in the composite version that were last modified in the source version.
Figure 1: The composition of the full source code. The composition of each version is broken-down into the lines of code originating from that version and from each prior version.
Figure 2: The composition of the source code directory within the kernel (sys/kern) that had the most vulnerabilities. The composition of each version is broken-down into the lines of code originating from that version and from each prior version.
3.3 Source code composition
We analyzed the collective changes to the OpenBSD code repository in order to establish how much code was altered/introduced in each version.
We first pre-processed each version of the source code. Only files with the suffix .c or .h were retained, and all comments were stripped. Furthermore, files whose name included keywords indicating that they belonged to an architecture other than x86 were removed.
After pre-processing was completed, each version was compared with each successive version. We used diff to compare files with the same path and filename. The diff tool was instructed to ignore changes in whitespace or the location of line breaks.
The OpenBSD development team sometimes moved or copied files, which is difficult to track via CVS. To detect copies and moves, files with the same name but different paths were also compared. If they were found to be identical, we replicated the file in the earlier version at the directory in which it was found in the later version. (These replicas were used only to determine if code in future versions derived from earlier versions: they were not used to calculate the total line count.)
The estimate of code commonality is highly conservative. The diff tool marked code lines as changed even for trivial alterations like global variable renaming and some types of reformatting---and the OpenBSD team has been reformatting the code base. In addition, this process will indicate that all of the code in a file is new if that file was moved/copied and then had just one line altered between versions. (Recall that the automated comparison process only understands that a file was moved if the file in the new location is an exact copy of the file in the old location.) Furthermore, if the name of a file is changed then all of the code in that file is considered to be new. The comparison data will thus understate the degree to which later releases are composed of substantively unchanged code from earlier releases.
4 Analysis
We now address our first four questions about the security of OpenBSD, using the vulnerability and source code composition data sets described above.
4.1 How much does legacy code influence security today?
The majority (87 of 140, or 62%) of the vulnerabilities found during the period of the study are foundational; that is, they were born prior to the release of the foundation version. We considered two hypotheses to explain why reported vulnerabilities were so often foundational: foundational code might be of lower quality than more recent code, or foundational code may constitute the bulk of the total code base.
The source code history data supports the latter hypothesis. Even after 7.5 years and 14 newer versions, the foundation version dominates the overall source code: at least 61% of the lines of code in version 3.7 are foundational, unchanged since the release of version 2.3. As a result, the security of the foundation version may still be driving the overall security of OpenBSD.
Table 2 illustrates the proportion of each version of OpenBSD that is derived from earlier versions. Each column represents a composite version; each row represents a source version that contributes code to the composite. Values represent the percentage of the lines of code in the composite version that originate in the source version.6 A line of code in a composite version of OpenBSD is said to originate in a source version if the line was last modified in that source version.
For example, the fifth column breaks down the composition of OpenBSD version 2.7. The top row of the column indicates that 6% of the lines of code originate in that version: they were either altered since the prior version or have been newly introduced. The second row from the top shows that 9% of the source code was altered/introduced in the prior version, 2.6, and was not changed after that version. The bottom row indicates that the bulk of the code in version 2.7 (79%) was both present in and remains unchanged since the foundation version.
Figure 1 shows a graphical representation of the composition of each version, using lines of code rather than percentages. Version 2.3 is composed of a single bar: by definition, all code in this foundation version is said to originate in it. For each successive version, a new bar is added to represent the lines of code that were altered/introduced in that release.
When we look more closely at Figure 1, several large alterations/introductions of code stand out: in versions 2.6, 2.9, and 3.5. The magnitude of the changes in versions 2.6 and 3.5 is primarily due to a large number of files being renamed and slightly altered. Our current methodology thus overstates the number of new lines of code and understates the contribution of code derived from earlier versions. The changes in version 2.9 are caused in part by the renaming of files; however, they were also the result of a major upgrade of the XFree86 package.
We were initially surprised that the number of lines of foundational code fluctuates both downwards and upwards. However, increases in the number of lines of foundational code are readily explained: source files unaltered since the foundation version were copied and used in other areas of the code.
Of all the second-level source code directories, the sys/kern directory contains the largest number of reported vulnerabilities. Fifteen of the seventeen vulnerabilities reported in this portion of the kernel were introduced in the foundation version. Figure 2 shows the evolving composition of the source code in the sys/kern directory. Many of the vulnerabilities in this subsystem have been in code related to the processing of signals: although this subsystem is part of the kernel, it does not include networking, file system, or virtual memory code. The code in one of the networking portions of the kernel (sys/netinet) has contributed ten vulnerabilities during the course of the study, seven of which are foundational.
Figure 3: The number of vulnerabilities introduced and reported within four years of release compared to the number of lines of code altered/introduced, by version.
4.2 Do larger code changes have more vulnerabilities?
Software engineers have examined the defect density of code: the ratio of the number of defects in a program to the number of lines of code. Some have argued that any well-written code can be expected to have a defect density that falls within a certain range, e.g. 3--6 defects per thousand lines of code (KLOC) [5]. We thus ask whether or not there is a linear relationship between the number of lines of code altered/introduced in a version of OpenBSD and number of vulnerabilities introduced in that version.
As we cannot measure the total number of vulnerabilities present, we measure the number discovered within four years of release for each version that is at least four years old. The number of vulnerabilities reported during this period is reported in the third column of Table 3. The fourth column contains the vulnerability density: the ratio of vulnerabilities reported to the number of lines of code in that version. In this instance, densities are reported in units of vulnerabilities per millions of lines of code (MLOC).
Figure 3 illustrates the relationship between the number of lines of altered/introduced code and the number of vulnerabilities reported. The standard correlation test (Pearson's r) is not applicable because we do not have enough data points. A non-parametric correlation test, Spearman's r, is unable reject the null hypothesis that there is no correlation: it calculates a correlation coefficient of 0.53 and a p-value of 0.18.7
We are thus unable to find a significant correlation between the number of lines of altered/introduced code and the number of vulnerabilities reported.
| |
|
Reported |
Reported |
| |
|
within 4 yrs |
by end |
| |
|
of release |
of study |
| Vers. |
MLOC |
Vulns |
Vulns/MLOC |
Vulns |
Vulns/MLOC |
2.3 |
10.14 |
59 |
5.8 |
87 |
8.6 |
| 2.4 |
.42 |
9 |
21.4 |
14 |
33.0 |
| 2.5 |
.28 |
4 |
14.3 |
6 |
21.8 |
| 2.6 |
1.05 |
8 |
7.6 |
9 |
8.6 |
| 2.7 |
.77 |
6 |
7.8 |
7 |
9.1 |
| 2.8 |
.40 |
0 |
0.0 |
0 |
0.0 |
| 2.9 |
2.23 |
4 |
1.8 |
4 |
1.8 |
| 3.0 |
.63 |
5 |
7.9 |
5 |
8.0 |
| 3.1 |
.81 |
|
|
2 |
2.5 |
| 3.2 |
.33 |
|
|
2 |
6.0 |
| 3.3 |
.32 |
|
|
2 |
6.2 |
| 3.4 |
.83 |
|
|
0 |
0.0 |
| 3.5 |
1.44 |
|
|
2 |
1.4 |
| 3.6 |
.74 |
|
|
0 |
0.0 |
| 3.7 |
.91 |
|
|
0 |
0.0 |
| Total |
21.30 |
95 |
6.0 |
140 |
6.6 |
| |
Table 3: Vulnerability and code modification statistics for each version of OpenBSD. MLOC is the number of lines of code (in millions) altered/introduced in each version.
4.3 Do today's coders introduce fewer vulnerabilities per line of code?
The vulnerability density of code added in new OpenBSD releases could provide an indication of the success of their efforts to produce secure code. On the other hand, code added by the OpenBSD team often provides security functionality: e.g. OpenSSH. As a result, that code is likely to attract a disproportionate share of attention from individuals searching for vulnerabilities; this extra attention may account for any differences between the versions' vulnerability densities.
For each release, Table 3 shows the number of reported vulnerabilities, the number of lines of code altered/introduced (in millions), and the vulnerability density. The third column shows the number of vulnerabilities reported within four years of each version's release, and the fourth column shows the corresponding vulnerability density. The fifth column shows the number of vulnerabilities reported during the entire study, and the sixth column shows the corresponding vulnerability density.
The vulnerability density of the foundation version is in the middle of the pack. Versions 2.4 and 2.5 stand out for having the highest vulnerability densities (33 and 21.8 reported per million lines of code at the end of the study, respectively).
The large ratio of reported vulnerabilities per line of code in version 2.4 seems to support the intuition that code providing security functionality is more likely to contain vulnerabilities. Version 2.4 saw the introduction of the Internet Key Exchange (IKE) key management daemon (isakmpd, two vulnerabilities introduced) and OpenSSL (three vulnerabilities introduced). As a result, the new code added in that release may have drawn particular attention from vulnerability hunters.
In version 2.5, two of the six vulnerabilities introduced were in the Apache program.
The density of reported vulnerabilities for code originating in versions 2.6, 2.9, and 3.5 are lower in part because of the inflated new-code counts for those versions (see Section 3.3).
When calculated per thousand lines of code, rather than per million, the density of all reported vulnerabilities ranged from 0--0.033 and averaged 0.00657. As noted above, some software engineers estimate the defect density of well-written code to be 3--6 per thousand lines of code [5]; these vulnerability densities are three orders of magnitude less than that amount. The two figures are not necessarily contradictory: defects include both vulnerabilities and bugs that are not vulnerabilities.
4.4 What is the median lifetime of a vulnerability?
Rescorla [11] applies an exponential model to his data, so he is able to ascertain the half-life of the vulnerability sets he considers: those half-lives range from 10 months to 3.5 years. Unfortunately, exponential models do not fit our data set (see Section 5). As a result, we are not able to ascertain, in a formal sense, the half-life of vulnerabilities in OpenBSD. Instead, we calculate the median lifetime of reported vulnerabilities: the time elapsed between the release of a version and the death of half of the vulnerabilities reported in that version.
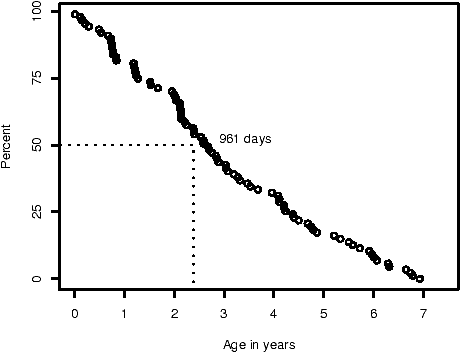
Figure 4: The lifetime of foundational vulnerabilities reported during the study period.
| Version |
Median lifetime |
|
2.3 |
878 |
| 2.4 |
1288 |
| 2.5 |
445 |
| 2.6 |
645 |
|
| |
Table 4: The median lifetime of vulnerabilities reported within the first six years of a version's release.
Figure 4 plots the age, at report, of foundational vulnerabilities. The data is necessarily right censored: we do not know that we have found all of the vulnerabilities in the foundation version. This data thus provides a lower-bound of 2.6 years (961 days) on the median lifetime of foundational vulnerabilities.
Is the median lifetime of vulnerabilities decreasing in newer versions? Table 4 depicts this time for those vulnerabilities identified within six years of the release of versions 2.3, 2.4, 2.5, and 2.6; this data relies upon the gross simplifying assumption that all vulnerabilities present were found within six years of each version's release. (We make this assumption so that we include the same time span after release for each version.) The results do not indicate a trend. During the course of the study, six vulnerabilities were identified that had been introduced in version 2.5: only five of those fell within the first six years after it's release. This lack of data partially explains the low median lifetime of vulnerabilities for version 2.5, and it highlights the limitations of this analysis.
The most striking part of this analysis is that the median lifetime of vulnerabilities is so long.
5 Are reporting rates declining?
We now address whether or not there has been a decline in the rate at which foundational vulnerabilities have been reported.
5.1 Illustrating reporting trends
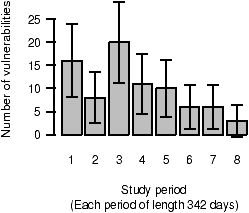
Figure 5: The number of foundational vulnerabilities reported during each eighth of the study.
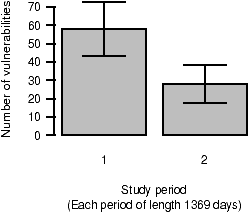
Figure 6: The number of foundational vulnerabilities reported during each half of the study.
Figures 5 and 6 categorize foundational vulnerabilities by the time period in which they were reported: we divide the study into periods of equal length.
The columns in Figure 5 represent the number of vulnerabilities reported in each of eight periods. The confidence intervals are derived from a normal approximation of a homogenous Poisson process. The confidence intervals are too large to permit effective analysis: by visual inspection alone, one can see that an exponential, S-shaped, or even a linear model could fit within these bounds.
However, more conclusive results can be obtained by dividing the study period into halves, as shown in Figure 6. The number of vulnerabilities reported significantly declines from the first period (58 vulnerabilities) to the second (28 vulnerabilities). The 95% confidence interval for the first period ranges from 43.1 to 72.9; for the second period, it ranges from 17.6 to 38.4.
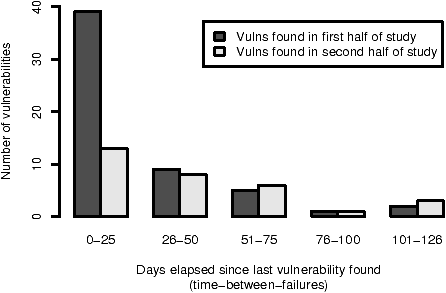
Figure 7: The number of days between reports of foundational vulnerabilities reported in the first half of the study compared with those reported in the second half.
Figure 8: Laplace test for the existence and direction of a trend in the rate of vulnerability reporting.
Time-between-failures |
Number |
| data |
of days |
|
Mean |
29.1 |
| Median |
18 |
| s |
29.14 |
| Minimum |
1 |
| Maximum |
126 |
|
|
Initial intensity |
0.051 |
| Current intensity |
0.024 |
| Purification level |
0.676 |
|
| |
Table 5: Measurements & predictions for foundational vulnerabilities.
Figure 9: Fitted Musa's Logarithmic model for foundational vulnerability report intervals. The vertical axis shows the time-between-failures: the number of days that have passed since the prior vulnerability was found.
Another way to examine the frequency of vulnerability reports is to measure the time between them. An analogous metric from reliability engineering, the time-between-failures (TBF), can be applied by defining a failure as the report of a vulnerability. Figure 7 groups foundational vulnerability reports by their time-between-failures. Each group appears as a pair of columns. The dark gray columns, the first column in each pair, represent vulnerabilities reported during the first half of the study. The light gray columns, the second column in each pair, represent vulnerabilities reported in the last half of the study.
Figure 7 shows that the second half of the study had far fewer foundational vulnerabilities with TBFs of 25 or less than the first half of the study (39 in the first half vs. 13 in the second half); the number of vulnerabilities with TBFs greater than 25 did not significantly change between the two halves (17 in the first half vs. 18 in the second half). The TBF ranges were chosen by dividing by five the maximum TBF of 126.
5.2 Analyzing reporting trends
We find a downward trend in the rate of vulnerability discovery, a result which contradicts previous work by Eric Rescorla [11]. His analysis failed to reject the hypothesis that the rate of vulnerability reporting has remained constant in three of the four operating systems he evaluated.
Our analysis above indicates a clear decrease in the rate of reporting of foundational vulnerabilities. In addition, we applied a Laplace test to make our data more directly comparable to the work of Rescorla. In the Laplace test, the discovery of vulnerabilities is assumed to be a Poisson process; the test assesses whether there is a decreasing or increasing trend with respect to inter-arrival times. The data we used were the number of days elapsed between the identification of each successive foundational vulnerability. These data are equivalent to those for time-between-failures in traditional models of reliability.
The lowest horizontal dotted line in Figure 8 is at a Laplace factor of -1.96. When the calculated Laplace factors are less than that amount, the data indicates a decreasing rate of vulnerability reporting with a two-tailed confidence level of 95%. The test finds evidence for a decrease in the rate of vulnerability reporting by the end of year four; by the end of year six, the evidence for a decrease in the reporting rate is statistically significant.
This test therefore supports our conclusion that the rate at which foundational vulnerabilities are reported is declining.
5.3 Fitting vulnerability data to reliability growth models
The case that OpenBSD is becoming more secure can also be supported using reliability growth models. While normally applied to the more random discovery of defects, these models can also be applied to the reporting of vulnerabilities. Rescorla also applied two reliability growth models to his larger, less precise, data set. His results for both models matched his results with the Laplace test: he could not fit the models to three of the four operating systems he evaluated.
We analyzed the data with seven time-between-failures reliability growth models. One of the seven models had acceptable one-step-ahead predictive accuracy and goodness-of-fit for the data set: Musa's Logarithmic model.8
The estimates produced by Musa's Logarithmic model are presented in Table 5. The intensity is the number of vulnerabilities expected to be reported on a given day. The intensity on the first day of the study (the initial intensity) is 0.051; by the end of the study, the intensity has been more than halved, to 0.024 (the current intensity).
The purification level is a normalized estimate of how vulnerability-free the program is at the end of the period covered by the data set. A purification level of one would indicate a program entirely free of vulnerabilities [15]. Musa's Logarithmic model calculates that 67.6% of all foundational vulnerabilities were reported during the study.
Figure 9 shows the successfully fitted Musa's Logarithmic model superimposed over the data set. The y-axis indicates the time-between-failures in days (the number of days that elapsed since the prior vulnerability was reported). Although the data points are widely scattered, the model indicates a trend toward an increasing time between vulnerability reports. In particular, far fewer of the later vulnerabilities are reported within ten days of each other.
The reliability growth analysis thus indicates that the rate of foundational vulnerabilities reported is decreasing.
6 Related Work
Our study builds on prior work in software reliability growth and on efforts to characterize the social utility of finding and reporting vulnerabilities.
We have applied models that define software reliability in terms of the number of faults in a body of code. Such models ``apply statistical techniques to the observed failures during software testing and operation to forecast the product's reliability'' [2, p. 6]. As faults are identified and removed, the system will fail less frequently and hence be more reliable. These models can thus be utilized to estimate characteristics about the number of faults remaining in the system and when those faults may cause failures. These estimates can be then be used to gauge the amount of further testing required to meet reliability requirements.
Eric Rescorla first applied reliability growth models to post-release vulnerability reporting data in order to question the social utility of publicly disclosing vulnerabilities [11]. He found no clear trend reduction in the rate of vulnerability reporting, and he estimates that the half-life of a vulnerability is between 10 months and 3.5 years. However, the ICAT database he uses is not focused on vulnerability age, and it does not reliably report the dates on which vulnerabilities were born.9 For our analysis, we used the version control system to ascertain the exact date of birth for each vulnerability in our data set. Furthermore, we test more models (seven) than the two that he evaluated. In addition, we only present results from the model that passed both goodness-of-fit and one-step-ahead predictive accuracy tests; Rescorla only utilized the former test.
Another related body of literature looks at measuring software security through market-mechanisms. L. Jean Camp and Catherine Wolfram proposed a market through which vulnerability credits could be traded; such markets have worked previously to create incentives for the reduction of negative externalities like environmental pollutants [3].
Prior to this collaboration, Stuart Schechter proposed creating markets for reports of previously undiscovered vulnerabilities, in order to measure software security. He argued that the bid, ask, and most recent sale prices in such a market approximate the labor cost to find a vulnerability. He further argued that these prices can establish which of two products the market deems to have vulnerabilities that are less expensive to find [12], [13]. Andy Ozment has separately proposed that a vulnerability market could be better designed as an auction; he then used the economic literature on auctions to refine the proposed design [9].
Given the emergence of a black market for reports of undiscovered vulnerabilities, metrics that estimate the cost to discover a vulnerability may be more valuable than those that measure the reporting rate. Several organizations are now actively purchasing vulnerabilities, so an open market or auction as described in this literature is not infeasible. Unfortunately, the business models of some of these organizations are not socially optimal [6]. Furthermore, these organizations are not sharing pricing information, hindering the movement toward an open market or auction. Until such an entity or entities arise---and until that entity has gathered several years of data---other means of measuring software security are necessary.
One path forward for future research into vulnerability reporting rates is to employ more sophisticated modeling techniques. The reliability growth literature is rich with means of improving models' accuracy. In addition, vulnerability analysis can be combined with traditional `software metrics:' metrics that attempt to measure a program's size, complexity, etc. If performed with an awareness of previous failures in this field, this line of research might lead to other fruitful measurements of or predictors of the rate of vulnerability discovery.
In future work, we plan to examine a competing operating system and compare the rate of vulnerability reporting in that product with the rate in OpenBSD. We hope to provide further insight on the success of secure coding measures, the level of effort expended to find vulnerabilities, and changes to the rate of vulnerability reporting in newly introduced code.
7 Conclusion
Over a period of 7.5 years and fifteen releases, 62% of the 140 vulnerabilities reported in OpenBSD were foundational: present in the code at the beginning of the study. It took more than two and a half years for the first half of these foundational vulnerabilities to be reported.
We found that 61% of the source code in the final version studied is foundational: it remains unaltered from the initial version released 7.5 years earlier. The rate of reporting of foundational vulnerabilities in OpenBSD is thus likely to continue to greatly influence the overall rate of vulnerability reporting.
We also found statistically significant evidence that the rate of foundational vulnerability reports decreased during the study period. We utilized a reliability growth model to estimate that 67.6% of the vulnerabilities in the foundation version had been found. The model's estimate of the expected number of foundational vulnerabilities reported per day decreased from 0.051 at the start of the study to 0.024.
Acknowledgements
The authors thank Rich Lippman for his advice on the statistical analysis. We also greatly appreciate the comments and feedback provided by Ross Anderson, Robert Cunningham, David Purdy, and Eric Rescorla.
References
- [1]
-
Abdel-Ghaly, A. A., Chan, P. Y., and Littlewood, B.
Evaluation of competing software reliability predictions.
IEEE Transactions on Software Engineering 12, 9 (1986),
950--967.
- [2]
-
AIAA/ANSI.
Recommended Practice: Software Reliability.
ANSI, 1993.
R-013-1992.
- [3]
-
Camp, L., and Wolfram, C.
Pricing security.
In Proceedings of the CERT Information Survivability Workshop
(Oct. 2000), pp. 31--39.
Boston, MA, USA.
- [4]
-
de Raadt, T.
Exploit mitigation techniques (in OpenBSD, of course).
In Proceedings of OpenCON 2005 (Nov. 2005).
Venice, Italy.
- [5]
-
Hatton, L.
Re-examining the fault density - component size connection.
IEEE Software 14, 2 (1997), 89--97.
- [6]
-
Kannan, K., and Telang, R.
Economic analysis of market for software vulnerabilities.
In Workshop on Economics and Information Security (May 2004).
Minneapolis, MN, USA.
- [7]
-
NIST.
NVD metabase: A CVE based vulnerability database.
http://nvd.nist.gov.
- [8]
-
OpenBSD.
CVS -- OpenBSD security page, revision 1.12, Feb. 1998.
http://www.openbsd.org/cgi-bin/cvsweb/~checkout~/www/security.html?rev=%
1.12&content-type=text/html.
- [9]
-
Ozment, A.
Bug auctions: Vulnerability markets reconsidered.
In Workshop on Economics and Information Security (May 2004).
Minneapolis, MN, USA.
- [10]
-
Ozment, A.
Software security growth modeling: Examining vulnerabilities with
reliability growth models.
In Proceedings of the First Workshop on Quality of Protection
(September 2005).
Milan, Italy.
- [11]
-
Rescorla, E.
Is finding security holes a good idea?
In Workshop on Economics and Information Security (May 2004).
Minneapolis, Minnesota.
- [12]
-
Schechter, S.
How to buy better testing: Using competition to get the most security
and robustness for your dollar.
In Infrastructure Security Conference (Oct. 2002).
Bristol, UK.
- [13]
-
Schechter, S.
Quantitatively differentiating system security.
In Workshop on Economics and Information Security (May 2002).
Berkeley, CA, USA.
- [14]
-
Stoneburner, W.
SMERFS (Statistical Modeling and Estimation of Reliability
Functions for Systems), Jan. 2003.
http://www.slingcode.com/smerfs/.
- [15]
-
Tian, J.
Integrating time domain and input domain analyses of software
reliability using tree-based models.
IEEE Transactions on Software Engineering 21, 12 (Dec. 1995),
945--958.
- 1
- This work is sponsored by the I3P under Air Force Contract FA8721-05-0002. Opinions, interpretations, conclusions and recommendations are those of the author(s) and are not necessarily endorsed by the United States Government.
- 2
-
This work was produced under the auspices of the Institute for Information Infrastructure Protection (I3P) research program. The I3P is managed by Dartmouth College, and supported under Award number 2003-TK-TX-0003 from the U.S. Department of Homeland Security, Science and Technology Directorate. Points of view in this document are those of the authors and do not necessarily represent the official position of the U.S. Department of Homeland Security, the Science and Technology Directorate, the I3P, or Dartmouth College.
- 3
- Currently at the University of Cambridge
- 4
- ICAT is now known as the National Vulnerability Database (NVD) [7].
- 5
- The release of a public report and the repair of the vulnerability do not always occur in the same order. When a vulnerability is reported to an entity other than the OpenBSD development team, the date of the public report often precedes the date on which a repair is committed to CVS. When a vulnerability is reported directly to the OpenBSD development team, they usually commit a repair into the CVS repository prior to publicly announcing the vulnerability. We utilize the earlier of the two dates so that we most closely approximate the date of actual discovery.
- 6
- Because the percentages were rounded, the total percentage for each version may not exactly equal one hundred.
- 7
- A correlation coefficient of 1 would indicate a positive linear correlation, -1 would indicate a negative linear correlation, and 0 indicates no correlation.
- 8
- The SMERFS3 reliability growth modeling tool was used to assess the models [14]. Musa's Logarithmic model had acceptable bias (0.13), noise (0.40), trend (0.09), and Kolmogorov distance goodness-of-fit (0.09397) results. Bias is determined by a µ-plot; it assesses the absolute predictive accuracy of the models. The noise and trend results are useful primarily to ensure that the predictive accuracy indicated by the µ-plot results was not due to opposing trends of inaccuracy canceling each other out on the average. For a more detailed explanation of the acceptability tests, see [1].
- 9
- In particular, the ICAT database may omit the fact that out-of-date versions of a program include a vulnerability. As a result, vulnerabilities may appear to have been introduced in much newer versions of a program than is actually the case.
This document was translated from LATEX by
HEVEA.
|