|
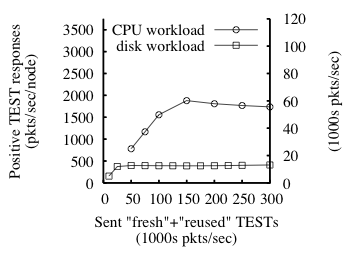
Fig. 8: For a 32-node enforcer, mean response rate to TEST requests as function of sent
TEST rate for disk- and CPU-bound workloads. The two y-axes show the
response rate in different units: (1) per-node and (2) over the
enforcer in aggregate. Here, r=5, and
each reported sample's standard deviation is less than 9% of its mean.
|
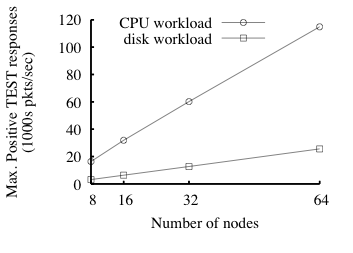
Fig. 9: Enforcer capacity under two workloads as a function of number
of nodes in the enforcer.
The y-axis is the same as the right-hand y-axis in Fig. 8.
Standard deviations are smaller than 10% of the reported means.
|
