We then perform sensitivity analysis to study the effect of varying the
parameters of the topology.
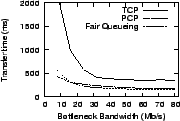
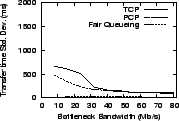
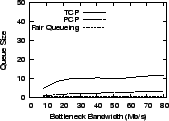
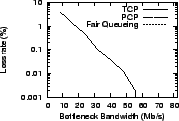
Figure 8 presents the various metrics as the
bottleneck bandwidth is varied. The rate of flow arrivals is set such
that the offered load to the system is 60%
of the bottleneck capacity for the various runs of the
experiment. At lower capacities, TCP's slow-start phase overruns the
available bandwidth resources, causing packet loss storms,
resulting in substantial back-off and increased transfer times. TCP's
transfer time performance levels out with increasing bandwidth, but
never approaches the performance of PCP due to the ![]() overhead
associated with the startup phase.
overhead
associated with the startup phase.
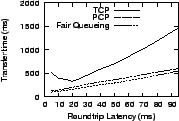
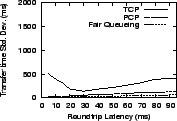
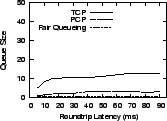
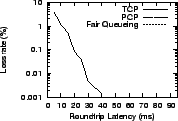
Figure 9 illustrates the performance of various flows
through our base configuration of a 40 Mb/s bottleneck router as we
vary the round-trip latency of the flows. We again consider
fixed-size flows of length 250 KB, and we also fix the offered load
at 60% (twelve new flows per second for this
configuration). The average round-trip latency is varied from
5ms to 100ms, and the buffer space is set to the corresponding
bandwidth-delay product for each run. At small RTTs, TCP flows tend
to blow out the small router queues rather quickly, while at high
RTTs, the ![]() slow-start overhead translates to much higher
transfer times. PCP flows track the performance of fair queueing
under all RTT conditions.
slow-start overhead translates to much higher
transfer times. PCP flows track the performance of fair queueing
under all RTT conditions.
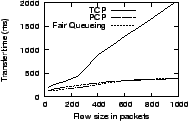
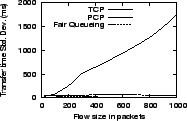
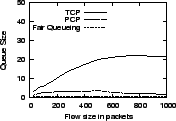
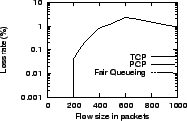
We also study performance as we vary the mean flow length. Figure 10 graphs the various performance metrics as we vary the flow size and correspondingly vary the arrival rate in order to fix the offered load at 60%. As we study the performance of TCP flows, we observe a tradeoff between two competing phenomena. As we increase the flow lengths, the initial slow-start overhead is amortized over a larger transfer. The resulting efficiency is however annulled by increased loss rates as there are a sufficient number of packets per flow for TCP to overrun buffer resources during the slow-start phase.
|
|
|