|
| |||||||||||||||||||||||||||||||||||||||||||||||||||

| ||||||||||||||||||||||||||||||||||||||||||||||||||||
|
LISA 2002 Paper
Network-based Intrusion Detection - Modeling for a Larger Picture(Berkeley, CA: USENIX Association, 2002). AbstractThe Internet is changing computing more than ever before. As the possibilities and the scopes are limitless, so too are the risks and chances of malicious intrusions. Due to the increased connectivity and the vast spectrum of financial possibilities, more and more systems are subject to attack by intruders. One of the commonly used method for intrusion detection is based on anomaly. Network based attacks may occur at various levels, from application to link levels. So the number of potential attackers or intruders are extremely large and thus it is almost impossible to ``profile'' entities and detect intrusions based on anomalies in host-based profiles. Based on meta-information, logical groupings has been made for the alerts that belongs to same logical network, to get a clearer and boarder view of the perpetrators. To reduce the effect of probably insignificant alerts a threshold technique is used. IntroductionIntrusion detection today covers a wider scope than the name suggests. IDS systems are tasked to detect - reconnaissance, break-ins, disruption of services and attempts at any of these activities. IDS systems are also expected to identify the perpetrator or provide useful clues toward that end. Some IDS systems adopt defensive actions when faced with a (potential) attack. In classical host-based intrusion detection [2] - anomaly based detection techniques are employed. Anomaly is detected by comparing the profile or behavior of entities with their normal profiles. Profile is the pattern of actions of subjects on objects. The entity-space should be small enough to enable profiling of entities or groups of entities. The entity itself might be the perpetrator [or, is compromised by the perpetrator]. Network-based attacks which generally precede host break-ins do not lend themselves to easy profiling. An attack may occur at the link level, network level, transport level or at the application level. Thus the entities that are potential attackers or intruders are not just users with user-ids but link-level entities represented by MAC addresses, network level entities (represented by network addresses), transport level entities (represented by network address and transport protocol) or network application level entities (represented by network address, transport protocol, and port address). This leads to an explosion in the entity space making it all but impossible to ``profile'' entities and detect intrusions based on anomalies with respect to the profiles. Effectively, all communication - packets or trains of packets need to be examined to detect traces of (attempted) mischief. If (potential) mischief is detected, identifying the perpetrator is a hard task. The perpetrator is generally not directly related to the packet or datagram which is the only clue to the offender in the network context. The source address in the relevant IP datagram may vary over time for the same attack due to DHCP assignment or, due to deliberate maneuvers by the attacker. In one special case the source address may be spoofed altogether. In a similar manner identifying the target of the attack may be difficult - the destinations may range over several ports of several hosts and over several networks. The target may be an application, a host, a network or networks of an organization, region or country. The perpetrator may be an application, a host, a network or even networks from a region or a country. Added to the inherent difficulty in identifying the perpetrator and/or target is the fact that the rules or signatures that are employed to detect (potential) mischief are simplistic. Presence of the signatures do not necessarily signify mischief. Moreover, in the open Internet there are deliberate mischief makers making a concerted effort to break-in, the unwary user who (probably) unintentionally fires off a scan or mischievous program and malfunctioning programs that send off suspicious looking packets. The end result is a profusion of alerts from Intrusion detection systems. When looked at in isolation the alerts make little sense, and serve little more than log messages destined for posterity. To provide greater visibility of (potential) attacks, perpetrators and targets, we have devised a model that aggregate entities and actions into logical super-entities and actions. Thus a set of host-IP addresses, get clubbed into a logical network. And attacks from this logical network constitute a larger attack. To reduce the noise of (probably) irrelevant alerts that effectively hinder the identification of actual offenses and offenders, a thresholding technique is used. Experimental results shows the effect of our model, which is based on logical groupings and threshold techniques. In the next section, we will discuss about the background and related works. Then we will talk about our proposed model of Network-based Intrusion Detection and subsequently about the observation environment of our case study and its evaluation. We then conclude our work. BackgroundIt is very important that the security mechanism of a system are designed so as to prevent unauthorized access to system resources and data. The conventional approach to secure a computer or network system is to build a protective shield around it. External users must identify themselves to enter the system. This shield should prevent leakage of information from the protected domain to the outside world. But it is not possible to design a system which is completely secure. We can however try to detect these intrusion attempts so that action may be taken to repair the damage and also the identification of the perpetrators and their victims. If there are attacks on a system we would like to detect them as soon as possible, preferably in real-time and take preventive measure. This is essentially what an Intrusion Detection System (IDS) does. Techniques of intrusion detection can be divided into mainly two types. Anomaly based detection and Signature based detection. Anomaly detection techniques assume that all intrusive activities are necessarily anomalous. This means if we could establish a normal activity profile for a system, we could, in theory at least flag all system states deviating from the established profile by statistically significant amounts as intrusion attempts. But there are two possibilities, (i) anomalous activities that are not intrusive are flagged as intrusive (false positive) and (ii) anomalous activities that actually intrusive but not flagged (false negative). The second one is obviously more dangerous. The main issues in anomaly detection systems thus become the selection of threshold levels so that neither of the above two problems is unreasonably magnified. The concept behind signature detection schemes is that there are ways to represent attacks in the form of a pattern or a signature so that even variations of the same attack can be detected. So in some sense, they are like virus detection systems. Able to detect known attack patterns but of little use in case of unknown attack methods. The main issues in Signature detection systems are how to write a signature that encompasses all possible variations of the pertinent attack, and how to write signatures that do not also match non-intrusive activity. An interesting difference between these two schemes is that anomaly detection systems try to detect the complement of ``bad'' behavior, whereas signature detection system try to recognize known ``bad'' behavior. There are advantages and disadvantages for both of the detection approaches.
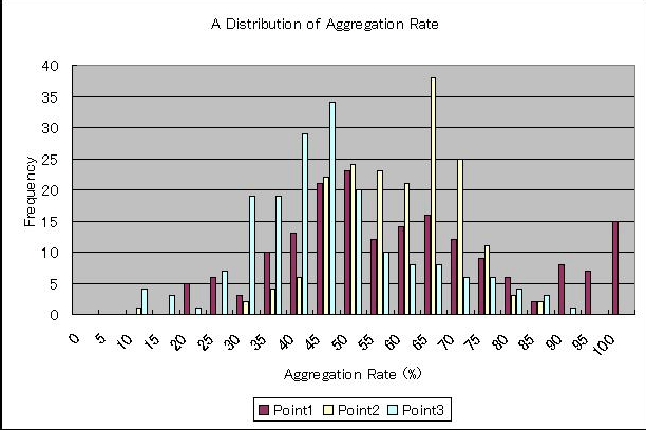
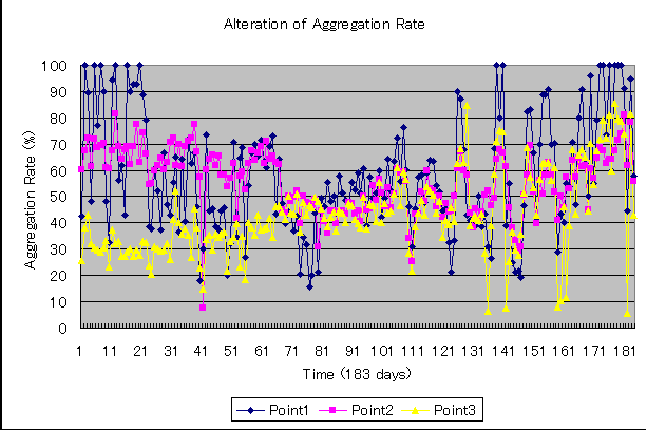
Early work on intrusion detection was due to Anderson [1] and Denning [2]. Since then, it has become a very active field. Most intrusion detection system (IDS) are based on one of two methodologies: either they generate a model of a program's or system's behavior from observing its behavior on known inputs [9], or they require the generation of a rule base [8]. A detailed discussion on network intrusion detection can be found in [6, 7]. Host based intrusion detection to network based detection correlates with the shift from single multi-user systems to network of workstations. As computers and networks get faster, we can process more audit data per unit time, but that same computer or network unfortunately produce audit data at a much higher rate as well. Hence the total ration of consumed resources to available resources is, if not constant, at least not decreasing at a sufficiently fast pace, that the performance of the intrusion detection system becomes a non-issue. The amount of data that need to be processed remains as a vital problem for intrusion detection. So it becomes much more difficult to detect network based attacks than host-based attacks. There is still lack of study in the field of coverage, of the intrusions the system can realistically be though to handle. The problems are both that of incorrectly classifying benign activity as intrusive and called false positive, and that of classifying intrusive activity as not-intrusive, as false negative. These mis-classifications lead to different problem. We tried to cover both the issues in this paper. Network-based Intrusion Detection ModelTo provide greater visibility of (potential) attacks, perpetrators and targets we have devised a model that aggregate entities and actions into logical super-entities and actions. Thus a set of host-IP addresses, get clubbed into a logical network. And attacks from this logical network constitute a larger attack. To reduce the noise of (probably) irrelevant alerts that effectively hinder the identification of actual offenses and offenders a thresholding technique is used. The logical groupings are carried out based on what we call meta-information or ``glue'' information. This meta-information is in effect a pool of ``hints'' which indicate how the pieces of a puzzle posed by the alerts (may) fit together to form a larger picture. Its contents are network topological information, organizational network information, Autonomous System (AS) information, routing information, Domain Name System information, geopolitical information. Most of these components are readily available in the network. The threshold is a tunable parameter. It can be varied to provide the best visibility. The larger pictureThe isolated incidents reported as alerts when seen in the context of the meta-information form a clearer picture. The application, server and/or network that is being targeted becomes clear, the source of the attack gets amplified and the relation between scans and subsequent attacks begin to emerge. The application of thresholds to filter out the noise makes the patterns even clearer. The significant effect is that we have a much clearer view of the perpetrator, and a much deeper understanding of the target of the attack. We have carried out case studies on several operational networks and verified the effectiveness of the approach. Case studyWe have carried out a case study by observing the alerts generated on three networks. The first, observation point 1, is a network connecting 10 computers, the second, observation point 2 is a network connecting approximately 30 computers, the third, observation point 3, connects a large scale campus network to the Internet. We used Snort [3] to detect suspicious traffic. We used about 1200 signatures. The profiles of the potential attacks were observed for 183 days. As the meta-information we used the IP-address to AS-number mapping available from the routing registry [4], organization to network address mapping using the DNS system, and organization to country mapping using a locally compiled database (with network sources as input). EvaluationClarity From Aggregation of ProfilesThree separate modes of aggregation are possible - source based, destination based and source-destination based. We experimented with all three modes and found source based aggregation to be the least effective. This is expected as more often that not the source addresses are spoofed. The effect of aggregation is most pronounced when destination based aggregation is carried out. The advantages of aggregation is twofold. First, it can reduce the total amount of data by less than half. So for analyzing the data, irrespective of either doing it by manually or not, it will be much more easier to handle if the volume of data is considerably less. Secondly, aggregation will give a much more clearer view of the attacker(s) and also about the victim(s). If we see the attacks individually it may look like they are coming from different places without any relation between them. But in aggregation, we can find whether those attacks are generated from the same network entity or not. Thus it will be easier to locate a perpetrator. Similarly, for destination (or victims of an attack) it will be easier to identify the actual target. For example, in case of port-scanning for a particular destination, apparently it may look different, but in aggregation we can find which destination the attacker is targeting. Because in both the cases aggregation can give amplified picture of the source and destination of an attack. We then compared number of profiles generated using conventional methods and proposed methods. We define a rate of aggregation as:  Table 1 shows the total numbers of profiles for the 183 days as seen in the data at the three observation points. The data for the source-destination based aggregation is given here. From this table it is clear that due to aggregation the amount of data has been reduced to less than half indicating greater feasibility of analysis. Not only that, it will also bring clarity. The aggregation scheme enables one to detect types of attacks which could not be detected otherwise. If source IP addresses are aggregated, an attack from distributed sources in a single network would be more likely to be detected. While, if destination addresses are aggregated, an attack which apparently looks like aimed at different individual Figure 2 shows the distribution of the rates of aggregation per day, where the horizontal axis is the rate of aggregation and the vertical axis is the frequency (the number of days). Figure 3 shows the change of the rate of aggregation during the period of observation. The horizontal axis is time (183 days) and the vertical axis is the rate of aggregation.   Simple AS based aggregation reduces the number of profiles by a factor of approximately 50%. The result at observation point 3 shows that such aggregation is more effective when Internet traffic is involved. We see that the aggregation varies for almost everyday as shown in Figures 2 and 3. There are days with no aggregation, and days when aggregation rate is very high.
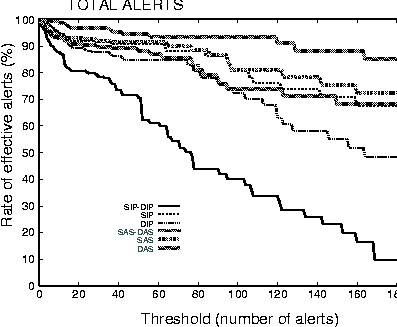
Another important observation is that the number of rejected alerts when thresholding technique is used in conjunction with the logical aggregation is much smaller than that when thresholding is used in isolation. This is significant as it implies that the results are safer and more accurate. In Figure 4 we have shown the effect of threshold for both IP based and AS based alerts. Here horizontal axis is the Threshold values and vertical axis is the percentage of number of alerts that has been covered (after ignoring the below-threshold value alerts). `SIP' and `DIP' means the `Source IP' and `Destination IP' respectively. Similarly, `SAS' and `DAS' means `Source AS' and `Destination AS.'  Obviously when the threshold value is zero, when there is no rejection of alerts, there is no chance of any `false negative.' Because at that time we are considering every single alerts into our account. Increase in threshold value (increase the rejected alerts) affect the IP based alerts much more than AS based alerts. It implies that AS based grouping is more effective for getting a more clearer picture of the attacker and the victim as well, as it is covering a greater range. At the same time it is also an indicator that in our approach the chance of `false negative' is very low. Because even after increasing the threshold value to a much higher degree, the total number of rejected alerts are comparatively lower than that of conventional IP-based approach. And in our model, even if it may not reduce but there is no scope of increasing `false positive' alerts than conventional models. ConclusionThe aggregation technique envisaged in the model helps in providing much greater clarity to the results. When used in conjunction with the thresholding technique its effect is very significant. Results from the case studies show that it is possible to reduce the number of entities that require close attention, to a manageably small set. We have also found that in our approach the chance of rejecting actual intrusive alerts (false negative) is much less, which is considered as a far more serious problem than the problem of false positive. These techniques coupled with network configuration information and network visualization techniques [5] are likely to have a significant impact on intrusion detection systems. References[1] Anderson, J. P., ``Computer Security Threat Monitoring and Surveillance,'' Technical report, James P. Anderson Company, For Washington, Pennsylvania, April 1980.[2] Denning, Dorothy E., ``An Intrusion Detection Model,'' IEEE Transaction on Software Engineering, Vol. SE-13, No.2, February 1987, 222-232. [3] Roesch, M., ``Snort: Lightweight intrusion detection for networks,'' USENIX LISA'99, https://www.snort.org/, November 1999. [4] IRRd, Internet Routing Registry Daemon, https://www.irrd.net/. [5] Mansfield, Glenn, et al., ``Towards Trapping Wily Intruders in the Large,'' Computer Networks, Vol 34. Issue 4, October 2000. [6] Banerjee, Biswanath, L. Todd Heberlein, and Karl N. Levitt, ``Network Intrusion Detection,'' IEEE Network, May/June, 1994. [7] Axelsson, Stefan, ``Research in Intrusion-Detection Systems: A Survey,'' TR: 98-17, Revised August 19, 1999. [8] Bernaschi, M., E. Gabrielli, and L. V. Mancini, ``Operating System Enhancements to Prevent the Misuse of System Calls,'' Proc. of the 7th ACM Conference on Computer and Communications Security, pp. 174-183, Athens, Greece. [9] Forrest, S., S. Hofmeyr, A. Somayaji, and T. Longstaff, ``A Sense of Self for Unix Processes,'' Proc. 1996 IEEE Symposium of Security and Privacy, 1996. |
|
This paper was originally published in the
Proceedings of the LISA 2002 16th System Administration Conference, November 3-8, 2002, Philadelphia, Pennsylvania, USA.
Last changed: 24 Oct. 2002 aw |
|