|
| |||||||||||||||||||||||||||||||||||||||||||||||||||

| ||||||||||||||||||||||||||||||||||||||||||||||||||||
|
LISA 2002 Paper
RTG: A Scalable SNMP Statistics Architecture for Service Providers(Berkeley, CA: USENIX Association, 2002). AbstractSNMP is the standard protocol used to manage IP networks. Service providers often analyze the utilization statistics available from SNMP-enabled devices to make informed engineering decisions, diagnose faults and perform billing. However collecting and efficiently storing large amounts of time-series data quickly, without impacting network or device performance, is challenging in very large installations. We identify three crucial requirements for an SNMP statistical solution: (i) support for hundreds of devices each with thousands of objects; (ii) the ability to retain the data indefinitely; and (iii) an abstract interface to the data. We then compare the applicability of several tools in a service provider environment. Finally, we detail Real Traffic Grabber (RTG), an application currently in use on our national IP backbone which we developed in lieu of existing packages to meet our requirements. IntroductionData traffic statistics are valuable in all networks, but are particularly crucial in service provider and enterprise environments. Not only is the data used to make informed engineering decisions such as traffic engineering, capacity planning and over-subscription analysis, it is also used for denial-of-service tracking, billing and policy purposes. The Simple Network Management Protocol (SNMP) [4] is the standard protocol used for fault detection, diagnostics, device management and statistics gathering in IP networks. While the protocol mechanisms themselves are ``simple,'' the process of continually collecting, retaining, reporting and visualizing SNMP statistics data presents unique constraints in very large network installations. Worldcom is a large service provider with many disparate data networks and equally varied management systems. The particular Worldcom network we monitor is a national OC-48c (2.5 Gbps) backbone that has grown to approximately 110 devices each with an average of 100 interfaces. Scalability problems regularly plague service providers and other large networks scrambling to keep up with growth. The legacy systems gathering SNMP interface utilization statistics from our network were no exception and faced severe performance problems to the extent that they were unusable. Simultaneously, new requirements to monitor additional per-interface statistics emerged along with a need to generate various custom reports. At a minimum, we needed a new system that could record bytes, packets and errors for every interface in the network with a five-minute granularity. The system must also produce long-term (multiple-year) trends and reports and keep detailed usage information for billing and legal purposes. We identified three high-level requirements for our new system: the ability to (i) scale the statistics infrastructure to support hundreds of devices each with thousands of objects; (ii) retain the data indefinitely; and (iii) provide an abstract interface to the data. These requirements motivated the development of Real Traffic Grabber (RTG). RTG is a flexible, scalable, high-performance SNMP statistics monitoring system. All collected data is inserted into a relational database that provides a common interface for applications to generate complex queries and reports. RTG has many unique properties including: it runs as a daemon incurring no cron or kernel startup overhead, it is written entirely in C for speed incurring no interpreter overhead, it is fully multi-threaded for asynchronous polling and database insertion, it performs no data averaging and it can poll at sub-one-minute intervals. RTG runs in production on several networks and has proved to be an invaluable tool. In this paper we first compare the applicability of various open-source tools and solutions in a service provider statistics environment. Next we detail the implementation and operation of RTG. We then present performance data measured for various monitoring platforms including RTG. Finally, we present graphs and reports unique to RTG. The paper concludes with availability information and suggestions for future development. Survey of Existing Monitoring ApplicationsThere are many open-source tools for gathering SNMP data; CAIDA[Note 2] maintains an excellent list of Internet measurement tools [3]. We experimented with several of the most popular applications and while they were ideal for many circumstances, none fulfilled our complete requirements. A widely popular open-source application for visualizing link traffic is the Multi Router Traffic Grapher (MRTG) [7, 8]. MRTG is a Perl script that reads a configuration file and SNMP polls the listed devices. An external C program adds the result to an ASCII log file and then produces a series of traffic plots and corresponding HTML code. MRTG assumes that as the data ages, the importance of detailed information diminishes proportionately. Subsequently, MRTG implements a lossy storage mechanism whereby multiple older samples are averaged into a single data point representative of the entire time period to ensure a fixed-size database. The primary advantages of MRTG are its ease of setup and use and friendly web output. While the visualization piece was excellent, MRTG was not suitable for our environment for several reasons. With such a large network, MRTG could not poll and process all of the objects in the network within a five-minute interval. A MRTG process that did not complete on time led to multiple MRTG processes piling up, as MRTG is forcibly invoked via cron each sampling interval, exacerbating the speed problem further. The MRTG performance problems are due to its use of a flat ASCII log file, sequential SNMP polling and insistence on generating a new graphic image (either GIF or PNG) for each object every five-minutes. We examine the performance characteristics of MRTG in detail in a subsequent section. A second disadvantage with MRTG lies in its use of a fixed size database which guarantees decreasing resolution with time and the eventual discard of old samples. Further, the ASCII log file is difficult for other applications to interface with or correlate to a particular set of customers easily. In response to the performance issues in MRTG, the primary MRTG author created the Round Robin Database tool (RRDtool) [6] which re-implements the lossy storage technique found in MRTG in a pure binary format for speed improvements. RRDtool also offers much more flexibility than MRTG, allowing multiple data sources per archive, varying time resolutions and non-integer values. The graphing facilities are similarly flexible, now allowing on-demand graphs for arbitrary time periods and the ability to draw multiple data sources simultaneously. The redesign, however, does not address the data gathering (SNMP polling) aspect of the performance problem and does not meet our requirement to retain all data samples indefinitely. Cricket [1] is designed to provide a manageable interface to RRDtool; its hierarchical configuration tree using inheritance works particularly well for large networks. Cricket is a set of Perl scripts that gather information about the network topology, set up RRDtool properly, and use the Perl SNMP module [5] to collect statistics. The end result is a set of easy to navigate web pages with RRDtool traffic plots similar to those provided by MRTG. We were impressed by the ease of configuration and useful web output of Cricket. While Cricket combined with RRDtool offers impressive flexibility and speed, we desired a more generic interface to the data and felt that there were more speed improvements to be had. Cricket with RRDtool still incurs cron and Perl interpreter overhead, sequentially polls devices and averages data samples. Table 1 summarizes the advantages and disadvantages of the open-source tools we evaluated and the primary use of each. We include RTG in this table for comparison. While MRTG, RRDtool and Cricket are appropriate for different environments, none met our performance or collection criteria. Schemes that perform long-term averaging can hide link peculiarities important to engineering. Based on the availability and relative low cost of fixed disk storage, our design constraint was to keep long-term data indefinitely without averaging. We also recognized that it was impossible to anticipate every user or application that would need access to the data. Thus, we wanted as abstract and open of an interface to the data as possible. The creation of RTG was motivated by the lack of suitable open-source tools and the inflexibility of available commercial solutions.
RTG ImplementationFrom our base requirements as a large service provider and our experience with other SNMP statistics packages, we developed RTG. RTG is comprised of rtgpoll (a polling daemon), rtgplot (a plotting program), rtgtargmkr.pl (a network configuration parser), a collection of Perl reporting scripts and a set of PHP scripts to provide a web interface. The RTG system centers around the polling daemon, rtgpoll. To provide the highest performance possible, the poller is written in C and runs as a daemon, utilizing less memory and fewer processor resources. Further, to allow asynchronous parallel querying and prevent any single query from blocking other polls, rtgpoll is fully multi-threaded A thread per SNMP query is used such that the poller maintains a constant number of ``queries in flight,'' greatly improving performance. An often overlooked performance problem lies in the network devices themselves. The SNMP agent on many IP devices consumes significant resources in response to queries, particularly when many objects are polled. To equalize the query load and prevent device CPU starvation which may inadvertently cause routing problems or service instability, RTG randomizes the target list before polling. In this manner, even if the target file lists devices sequentially, rtgpoll SNMP queries individual object identifiers (OIDs) of the devices at random. Whereas our previous SNMP management software inflicted noticeable CPU spikes on the network devices, no spikes are evident with this scheme. An added benefit to this randomization strategy is that should a device be physically down or unreachable, all of the rtgpoll threads will not block waiting for the device query to timeout. Thus, a single device that is unreachable has little or no impact on the overall RTG poll cycle time. The rtgpoll program reads a master configuration file, rtg.conf, and a target file. The configuration file contains general RTG parameters while the target file contains the list of SNMP targets, SNMP communities, OIDs, SQL tables and other information. An auxiliary Perl script included in the RTG distribution, rtgtargmkr.pl, maintains the target file and ensures that the interface information in the database is kept up to date. rtgtargmkr reads a list of devices, SNMP fetches each interface name, description and speed, and maintains database consistency. For instance, the SNMP interface identifier for a particular interface can change between network device reboots or after adding a new interface to a network element. The rtgtargmkr script manages these changes and detects new interfaces or interface description changes. The target list is re-read when rtgpoll traps the UNIX HUP signal, allowing for dynamic reconfiguration without restarting the daemon. We run rtgtargmkr periodically via a cron job and then send rtgpoll a HUP signal so that RTG always maintains an accurate view of the network. Each target is SNMP polled at the interval specified in the rtg.conf file and the result is inserted into a MySQL [11] database. We chose MySQL because it is open source, very fast, portable, has a large installed user base and has multiple application programming interfaces (APIs), including C, PHP, Perl. While it is technically feasible to use other databases, for instance for users with existing database infrastructure, this would require significant reprogramming of RTG. We are very pleased with the performance and stability of MySQL for RTG and have seen little interest in using other databases. Figure 1 presents a functional diagram of the RTG system. 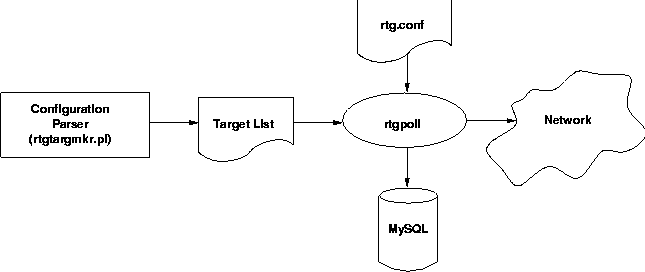 RTG can poll either 32 or 64-bit integers and gracefully handles counter wrap and anomalous values. Counter wraps are detected when the SNMP result is less than the previous SNMP result from the last sample interval for a particular OID. When RTG encounters a counter wrap, the database insert value is calculated as either (232 - last_value) + current_value or (264 - last_value) + current_value depending on the OID integer size. Unfortunately, in practice some counter wraps are not legitimate. Often if a device is rebooted between polling intervals, the SNMP value returned after the reboot will be less than the previous value RTG maintains. RTG eliminates these bogus data points by defining a configurable out-of-range value above which rtgpoll will never attempt an insert into the database. The out-of-range value is typically configured as a multiple of the maximum number of bytes possible in the defined interval on the highest speed link. To meet the long-term storage requirement, RTG utilizes the MySQL database in combination with a highly efficient database schema. Every effort was made to minimize the amount of data that must be stored and maximize performance. We observed that most reporting and analysis applications are interested in router or interface specific data for a particular object, such as byte counts, over a time range. In order to minimize the amount of data any single query would have to process, minimize the amount of data stored and to segment the data as much as possible, we created a SQL table per unique device and object. Each table name contains the device identifier (rid), i.e., ifInOctets_9. In this unconventional fashion, the table name becomes significant as a unique index. Each of these tables contains only interface identification (iid), date/time and count columns. The table is further indexed by the date/time (dtime) column. Two additional tables provide router and interface index identifiers (rid and iid) as well as descriptions and names. The database schema is illustrated in Figure 2. 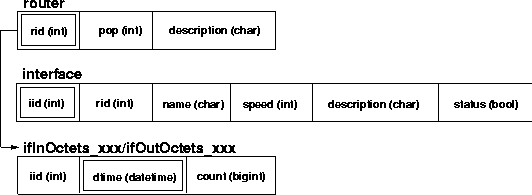 A potential drawback to this schema is that each device requires five tables corresponding to five or more files on the MySQL system. Because of this, the maximum number of devices is bounded by the operating system and MySQL's ability to speedily handle many files. Despite this limitation, this method has allowed us to retain more than two-years of complete data for over 100 devices without performance impact; reports for old data are generated as quickly as reports for new data. While different schemas may be more appropriate for other installations, this database schema provides the highest performance in our network. It is important to note that RTG does not impose any requirement to use this schema. In fact, the RTG table names are completely configurable in the target list file. For instance, some installations choose to use only five tables total corresponding to input and output octets, packets and errors. Using the aforementioned schema for each unique network element, the interface identifier (iid), timestamp and difference between the last SNMP sample and the current poll are inserted into the network element's unique table. Assume that a user has identified a device and interface of interest based on the device and interface descriptions in the RTG database. If the device and interface in question are rtr1.someplace with a router identifier (rid) of 9 and interface id (iid) 117 respectively, Listing 1 shows the MySQL query (limited to the first three rows) to gather ifInOctet data.
          mysql> SELECT * FROM ifInOctets_9 WHERE iid=117
                 AND dtime>'2002-07-14 18:50' ORDER BY dtime LIMIT 3;
          +------+---------------------+---------+
          | iid  | dtime               | counter |
          +------+---------------------+---------+
          | 117  | 2002-07-14 18:51:16 | 5092874 |
          | 117  | 2002-07-14 18:56:23 | 5857165 |
          | 117  | 2002-07-14 19:01:25 | 4762324 |
          +------+---------------------+---------+
Thus, only the absolute minimum amount of data is stored in the database preserving speed and storage space. On one production MySQL server, RTG is using approximately 5.5 GB of data and 3.9 GB of index space (total of 9.4 GB) to store two-years of data. We do not enforce any data periodicity in the database; it is the responsibility of the application to determine the total time elapsed between subsequent samples for any given table and interface should the application need to calculate traffic rates. RTG does not record rates, only absolute counts. In the previous example query, an application would calculate the rate as 4,762,324 Octets/302 sec=15.8KBps=126.2Kbps. Finally, RTG's high-performance has the added advantage of allowing sub-minute polling intervals for instances where high sample granularity is required. We present a real-world example of the utility of sub-minute polling in the RTG Reports section. Performance EvaluationBecause performance is a central component of RTG, we evaluated RTG, MRTG and Cricket for speed. All tests were performed on a dual 360 MHz Sun Ultra 60 workstation running the Solaris 2.7 operating system. We used the UNIX time command to observe the total execution time, user CPU and system CPU times for each application. We measured the performance five times and then took the simple mean of the five test runs. Each application's CPU utilization is presented in Table 2. While MRTG and Cricket use significantly more processor cycles than RTG, this data does not include the CPU utilization of RTG's MySQL server. Despite this, MySQL RTG CPU usage has never been a practical limitation in production environments and we note that it is possible to run the RTG polling daemon and the MySQL database on separate physical machines if needed.
The application performance data is presented in Table 3. Because in normal operation RTG runs continuously as a daemon, we modified the code to exit after five polling cycles thereby allowing us to use the UNIX time utility. The data shows that Cricket with RRDtool is far superior to MRTG. Cricket and a non-threaded version of RTG are comparable in speed, although RTG uses fewer CPU resources. Finally, the multi-threaded version of RTG is by far the fastest application in the group achieving approximately 107 targets per second in our testing. Assuming the traditional five-minute sample interval, this yields a theoretical maximum of 32,000 OIDs monitored on a single RTG system before saturation, almost five times as many as Cricket and twenty-four times more than MRTG. Whereas with other systems it is not possible to query just byte statistics on the entire network within the sample period, the speed of RTG allows us to not only monitor all devices in the network, but also to monitor additional objects per interface. For example, we now monitor the SONET Management Information Base (MIB) [10] to proactively track transmission problems and the MPLS MIB [9] to analyze Label Switched Path (LSP) traffic. Every five minutes, our production RTG system processes approximately 5000 OIDs in approximately 60 seconds leaving ample room for future growth. We suspect that even higher performance is possible by increasing the number of threads, and hence the number of queries in flight, beyond the default of five. Because the performance is more than acceptable, we are hesitant to increase the number of threads on our production RTG for fear of overwhelming the network or the network devices. We note also that the architecture of RTG easily allows separation of the various components. For instance, multiple instances of the RTG poller could be distributed throughout the network while utilizing separate physical machines for MySQL and web page or report generation to achieve even greater scalability. RTG ReportsOur experience shows that using a SQL database provides an ideal abstract interface to the data. The available Perl, PHP or C API's facilitate rapid prototyping and allow for the design of highly customized reports and tools. In our case, the engineering group currently receives a nightly traffic report including total bytes, packets, maximum rate and average rate for the backbone routers via a scheduled Perl DBI script. Each morning engineers can peruse this email for interesting events that may require attention. Listing 2 shows example output from the Perl traffic summary report. Traffic Daily Summary Period: [01/01/1979 00:00 to 01/01/1979 23:59] Site GBytes In GBytes Out MaxIn(Mbps) MaxOut AvgIn AvgOut ---------------------------------------------------------------------------- rtr1.someplace: so-5/0/0 384.734 360.857 49.013 43.420 35.630 33.426 so-6/0/0 357.781 421.736 42.923 50.861 33.137 39.053 t1-1/0/0 0.054 0.058 0.005 0.006 0.005 0.005 rtr3.someplace: so-6/0/0 1,115.258 1,246.163 168.776 172.690 103.173 115.439 so-3/0/0 1,142.903 1,028.256 152.232 162.402 105.863 95.142 so-7/0/0 152.824 199.742 22.052 35.005 14.152 18.488 included in the RTG distribution. Because no averaging is used, absolute numbers such as the total number of Gigabytes are shown and the report result for a specific time period will be the same regardless of when the report is generated. This consistency is invaluable for accurate trending and accountability. Because the data is stored in a relational database, it is straightforward to generate a traffic report for a single customer or a subset of customers for any arbitrary time period. Listing 3 depicts output from the 95th percentile Perl report included with the RTG distribution. This report shows a customer's usage on three circuits including their 95th percentile rate, a metric often used for billing in the telecommunications industry.
ABC Industries Traffic
Period: [01/01/1979 00:00 to 01/31/1979 23:59]
                         RateIn   RateOut    MaxIn   MaxOut   95% In  95% Out
Connection                 Mbps      Mbps     Mbps     Mbps     Mbps     Mbps
-------------------------------------------------------------------------------
at-1/2/0.111 rtr-1.chi     0.09      0.07     0.65     0.22     0.22     0.13
at-1/2/0.113 rtr-1.dca     0.23      0.19     1.66     1.12     0.89     0.57
at-3/2/0.110 rtr-2.bos     0.11      0.16     0.34     0.56     0.26     0.40
Another Perl script we use regularly generates year-to-date trunk utilization data in comma separated value (CSV) format, a format that is easily imported into commercial spreadsheets. These reports are used by capacity planning groups and presented to upper management. An example graphic of year-to-date traffic generated by plotting the CSV data in a spreadsheet is shown in Figure 3. 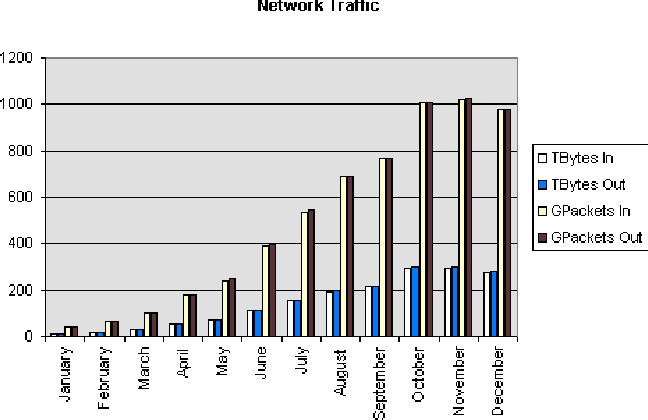 RTG includes a set of PHP web pages that provide a graphical view of circuit utilization for customers and support staff for any arbitrary time period. A key application included in the RTG distribution for web pages and traffic visualization is rtgplot. rtgplot is a C program that utilizes the GD library [2] to generate plots, similar to those generated by MRTG, in PNG format from the RTG database. rtgplot provides an extremely fast on-demand graphical interface to the data. rtgplot can be used as a stand alone application or embedded in web pages. A traffic plot can be placed easily in any web page by simply using the <IMG> HTML tag with the appropriate arguments. For instance <IMG SRC="rtgplot.cgi?t1=ifInOctets_2& t2=ifOutOctets_2&iid=49&begin=1028606400& end=1028692800&units=bits/s&factor=8& scalex=yes">will plot two lines of traffic data from the RTG MySQL tables ifInOctets_2 and ifOutOctets_2 corresponding to interface id 49 on router id 2 for the 24 hour period 1028606400 to 1028692800 (UNIX seconds since the epoch). The `factor' argument multiplies the byte data to produce bits per second output on the plot, while the `units' argument will be displayed on the vertical axis. The `scalex' argument will auto adjust the horizontal time axis according to the available data samples rather than according to the actual time span specified. Non-continuous data, such as errors, are plotted using the `impulses=yes' argument. Different time views, with no resolution decay, of the same circuit monitored by RTG are shown with rtgplot output in Figure 4. Note that each plot includes the absolute volume of bytes as well as the maximum, average and current traffic rates for the time range. 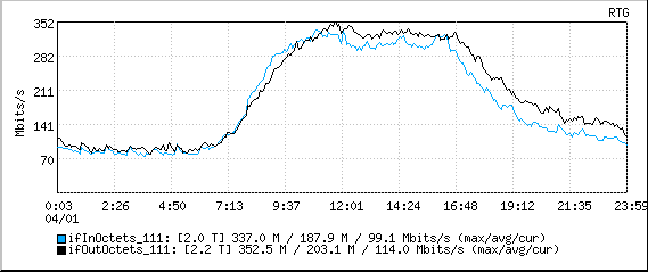 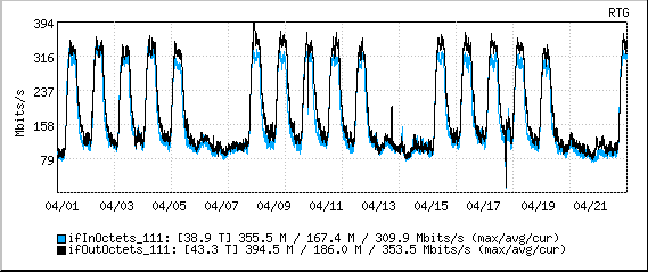 Finally, the utility of an SNMP tool that is extremely fast and supports sub-one minute polling is underscored by a recent example where a customer OC-3c circuit (155 Mbps) was experiencing performance degradation due to packet loss. Quickly examining the RTG plot for the circuit did not immediately reveal any congestion. We then configured RTG to poll this interface every 30 seconds rather than every five-minutes. Figure 5 shows two plots of this interface over the same time period. The upper plot is the result from polling every five minutes whereas the lower plot is the result from polling every 30 seconds. Clearly the five-minute polling interval masked the customer's traffic bursts that were causing packet loss. While the plot generated from five-minute samples shows a peak input rate of 63.4 Mbps, the plot generated from the 30-second samples shows a peak input rate of 140.3 Mbps. Data averaging would mask this type of problem even further, particularly as the data aged. 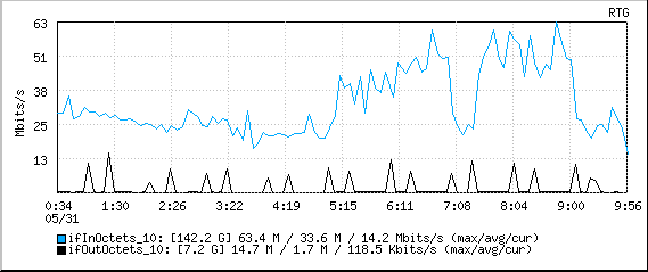 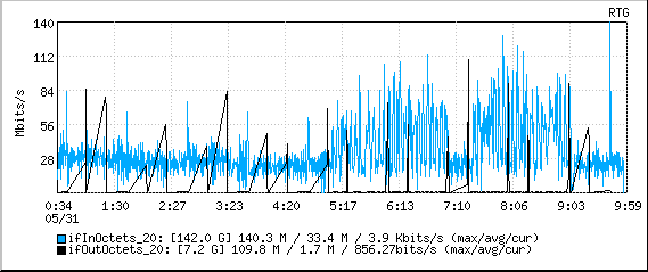 Future RTG DevelopmentWe are continuing to develop RTG and improve it based on feedback from the open-source community. In particular we are looking to increase the robustness of RTG by employing a buffering mechanism to buffer SNMP results in case the SQL database is down or unreachable. In addition, we want to develop functionality by which multiple RTG clients can communicate with one another to provide distributed polling and redundancy. We recognize that setup and installation of RTG is difficult and we plan to improve the configuration utilities, documentation, etc. Finally, we have received feedback about additional uses of RTG including implementing multi-grain storage techniques, as opposed to the traditional fixed sample interval, to isolate interesting variations in the data. This could potentially lead to the development of a denial-of-service detection or fault management system. RTG AvailabilityRTG is developed on Solaris, tested on FreeBSD and Linux, and should run on a wide variety of other UNIX platforms by virtue of a GNU autoconf script. There is no support for Windows platforms. RTG is available under the terms of the GNU GPL from the RTG web page hosted on SourceForge, https://rtg.sourceforge.net. Further information, including documentation, and mailing lists can be found on the RTG home page. AcknowledgmentsRTG was inspired by the excellent tools from Tobias Oetiker, Dave Rand and Jeff Allen. RTG uses, and is useless without, the MySQL, UCD SNMP, gd, png and cgilib packages. The author would also like to thank Kevin Thompson for his support of this work. Author BiographyRobert Beverly is currently pursing a PhD in Computer Science at the Massachusetts Institute of Technology. Most recently he was a senior engineer with Worldcom's Advanced Internet Technology group in Northern Virginia where he was responsible for the statistics and measurement infrastructure of several large networks. Prior to Worldcom's acquisition, Mr. Beverly worked for MCI Internet Engineering on the very-high-performance Backbone Network Service (vBNS). He received his Bachelor's degree in Computer Engineering from the Georgia Institute of Technology in 1996 with high honors. While at Georgia Tech, he worked for several years managing the campus UNIX systems and then spent two years working for the Office of Information Technology managing the campus backbone network. Reach the author at rbeverly@mit.edu. References[1] Allen, J., ``Driving by the rear-view mirror: Managing a network with cricket, Proceedings of the First Conference on Network Administration, April 1999.[2] Boutell, T., GD graphics library, https://www.boutell.com/gd. [3] CAIDA, Internet tools taxonomy, https://www.caida.org/tools/taxonomy/. [4] Case, J. D., M. Fedor, M. Schoffstall, and C. Davin, Simple Network Management Protocol (SNMP), RFC 1157, Internet Engineering Task Force, ftp://ftp.ietf.org/rfc/rfc1157.txt, May 1990. [5] Leinen, S., Perl 5 SNMP module, an SNMP client implemented entirely in Perl, https://www.switch.ch/misc/leinen/snmp/perl. [6] Oetiker, T., RRDtool, https://people.ee.ethz.ch/~oetiker/webtools/rrdtool. [7] Oetiker, T., ``MRTG - The Multi Router Traffic Grapher,'' Proceedings of LISA 1998, December 1998. [8] Oetiker, T. and D. Rand, MRTG, https://people.ee.ethz.ch/~oetiker/webtools/mrtg. [9] Srinivasan, C., A. Viswanathan, and T. Nadeau, Multiprotocol Label Switching (MPLS) Label Switch Router (LSR) management information base, Internet-draft, Internet Engineering Task Force, ftp://ftp.ietf.org/internet-drafts/draft-ietf-mpls-lsr-mib-08.txt, January 2002. [10] Tesink, K., Definitions of Managed Objects for the SONET/SDH Interface Type, RFC 2558, Internet Engineering Task Force, ftp://ftp.ietf.org/rfc/rfc2558.txt, March 1999. [11] Widenius, M., D. Axmark, and A. Larsson, MySQL AB, https://www.mysql.com. Footnotes: Note 1: The initial research was completed while with Worldcom. Note 2: Cooperative Association for Internet Data Analysis, https://www.caida.org |
|
This paper was originally published in the
Proceedings of the LISA 2002 16th System Administration Conference, November 3-8, 2002, Philadelphia, Pennsylvania, USA.
Last changed: 24 Oct. 2002 aw |
|