|
||||||||||||||
|
Sachin Katti
Balachander Krishnamurthy
Dina Katabi
MIT
AT&T Labs-Research
MIT
This paper presents the first wide-scale study of correlated attacks, i.e.,
attacks mounted by the same source IP against different networks. Using a
large dataset from ![]() intrusion detection systems (IDSs), we show that
correlated attacks are prevalent in the current Internet; 20% of all
offending sources mount correlated attacks and they account for more than
40% of all the IDS alerts in our logs.
We also reveal important characteristics of these attacks.
Correlated attacks appear at different networks within a few minutes of each
other, indicating the difficulty of warding off these attacks by occasional
offline exchange of lists of malicious IP addresses. Furthermore, correlated
attacks are highly targeted. The
intrusion detection systems (IDSs), we show that
correlated attacks are prevalent in the current Internet; 20% of all
offending sources mount correlated attacks and they account for more than
40% of all the IDS alerts in our logs.
We also reveal important characteristics of these attacks.
Correlated attacks appear at different networks within a few minutes of each
other, indicating the difficulty of warding off these attacks by occasional
offline exchange of lists of malicious IP addresses. Furthermore, correlated
attacks are highly targeted. The ![]() IDSs can be divided into small groups
with 4-6 members that do not change with time; IDSs in the same group experience
a large number of correlated attacks, while IDSs in different groups see almost
no correlated attacks. Our results have important implications on collaborative
intrusion detection of common attackers. They show that collaborating IDSs need
to exchange alert information in realtime. Further, exchanging alerts among the
few fixed IDSs in the same correlation group achieves almost the same benefits
as collaborating with all IDSs, while dramatically reducing the overhead.
IDSs can be divided into small groups
with 4-6 members that do not change with time; IDSs in the same group experience
a large number of correlated attacks, while IDSs in different groups see almost
no correlated attacks. Our results have important implications on collaborative
intrusion detection of common attackers. They show that collaborating IDSs need
to exchange alert information in realtime. Further, exchanging alerts among the
few fixed IDSs in the same correlation group achieves almost the same benefits
as collaborating with all IDSs, while dramatically reducing the overhead.
In this paper, we study correlated attacks, which we define as attacks
mounted by the same source IP against different networks. Currently, about
30,000 new machines are compromised daily [25], and then used to
launch attacks on other parts of the Internet.
In many cases,
the same machines are involved
in multiple attacks against different networks [25]-i.e., correlated
attacks. In addition to being an Internet phenomenon worthy of careful study,
correlated attacks are important for collaborative intrusion detection. The
intrusion detection system (IDS) at a network can exchange information about
recent alerts and offending IPs with other IDSs. Future packets from
suspicious source IPs can be flagged to be dropped or scrutinized. Such
collaboration is most effective when it happens between networks experiencing
correlated attacks.![[*]](footnote.png)
We present the first large scale empirical investigation of attack correlation
in the Internet. We analyze logs from ![]() IDS/firewalls deployed in US and
Europe. Our data is rich; in addition to sanitized logs from
DSHIELD [2] and multiple universities, it contains detailed
attack logs from 40 IDSs maintained by a Tier-1 provider to protect its
customer networks. The logs cover 1-3 months, and a big chunk of the IP
address space. In contrast to prior work, which has focused on the design of
collaborative intrusion detection
systems [28,29,21,9,26,22], we
address the following two questions:
IDS/firewalls deployed in US and
Europe. Our data is rich; in addition to sanitized logs from
DSHIELD [2] and multiple universities, it contains detailed
attack logs from 40 IDSs maintained by a Tier-1 provider to protect its
customer networks. The logs cover 1-3 months, and a big chunk of the IP
address space. In contrast to prior work, which has focused on the design of
collaborative intrusion detection
systems [28,29,21,9,26,22], we
address the following two questions:
Our study results in 4 major findings. (a) The extent of attack correlation: Correlated attacks are prevalent in the Internet; 20% of the offending IP sources attack multiple networks, and these common attackers are responsible for 40% of the total alerts in our dataset. Further, shared attackers attack different networks within a few minutes of each other, emphasizing the advantage of realtime IDS collaboration, as opposed to sharing attack logs offline.
(b) Reducing collaboration overhead by exploiting correlation structure: We analyze the spatial structure of attack correlation. We discover that the 1700 IDSs in our dataset can be divided into small groups of 4-6 members (about 0.4% of the IDSs in our set); IDSs in the same group experience highly correlated attacks, whereas IDSs in different groups see uncorrelated attacks. Collaborating with only IDSs in the same correlation group achieves the same utility obtained from collaborating with all IDSs, while dramatically reducing the collaboration overhead.
The small correlation groups seem to arise from recent attack trends. In particular, victim sites in the same group may be on a single hit list, or might be natural targets of a particular exploit like the Santy worm which attacked popular phpBB discussion forums scoured from search engines. We examined the correlated attacks in each group for cases where full attack details are available. Indeed, each group seems to be characterized by a specific attack type, e.g., there are SMTP groups, NT groups, IIS groups. This indicates that targeted attacks create small correlation groups of sites that run particular software/services.
(c) Scalable Trust Establishment: Our measurements reveal that correlation groups are fairly stable and their membership persists for the duration of the dataset (1-3 months). Thus, each network needs to collaborate with only 4-6 fixed networks in its group. The small number of IDSs in a group and their persistent membership allows a network to check their credibility offline and establish trust using an out-of-band mechanism such as legal contracts or reputation.
A network still needs to learn who is in its correlation group. This service can be provided by a few trusted nonprofit organizations, like CERT [1] and DSHIELD [2], or commercial entities. They receive sanitized alert data, (containing only time and offending source IP), from participating networks, analyze it for attack correlation, and inform the participating networks about others in their correlation group. The process is scalable because correlation groups are persistent for long intervals (months) and do not need frequent updates. Indeed, DSHIELD already has the means to provide this service to its participant networks.
(d) The importance of picking the right collaborators: We provide rough estimates of the overhead and detection capability obtained via different choices of collaborating IDSs. We focus on collaboration to quickly blacklist malicious IP sources. Using a trace driven simulation, we compare the following schemes: (1) correlation-based collaboration (CBC), where each IDS collaborates with only IDSs in its correlation group; (2) random collaborators, where an IDS collaborates with the same number of IDSs in its correlation group but picks the identity of its collaborators randomly. (3) local detection with no collaboration; (4) collaboration with all IDSs in the dataset;
The results of our evaluation emphasize the importance of picking the right collaborators. Mainly:
Table 1 defines the terms used in this paper.
|
 |
Our dataset is both large and rich.
We use logs collected at ![]() different IDSs deployed in US and Europe.
Our logs can be divided into
different IDSs deployed in US and Europe.
Our logs can be divided into ![]() distinct sets based on their origin: (1)
distinct sets based on their origin: (1) ![]() IDSs on different networks in a Tier-1 ISP; (2) DSHIELD Logs; (3) University
logs. The logs cover periods of 1-3 months. They span a relatively large
fraction of IP address space. In addition to a /8 ISP space, the DSHIELD data
contain logs from many /16 and /24 networks.
This is the first studied dataset of its size that provides detailed alert
information from deployed IDSs in the commercial Internet.
Table 2 provides a summary description of the dataset. A detailed description is below.
IDSs on different networks in a Tier-1 ISP; (2) DSHIELD Logs; (3) University
logs. The logs cover periods of 1-3 months. They span a relatively large
fraction of IP address space. In addition to a /8 ISP space, the DSHIELD data
contain logs from many /16 and /24 networks.
This is the first studied dataset of its size that provides detailed alert
information from deployed IDSs in the commercial Internet.
Table 2 provides a summary description of the dataset. A detailed description is below.
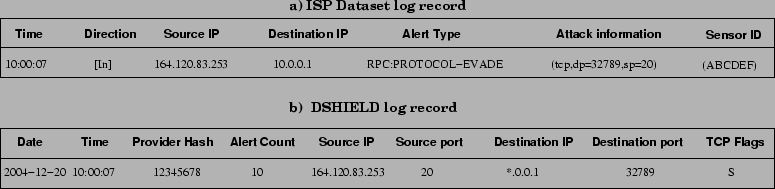
(a) ISP Logs: We have logs from 40 IDSs deployed in a large ISP with a /8 address space. The IDS boxes protect different customer networks and span a large geographic area, but they are all administered by the ISP and hence have identical characteristics and signature sets. The signature set is large and diverse consisting of over 500 different alerts. The logs contain full unanonymized packet headers for all suspicious packets, as shown in Figure 1a. Hence unlike the DSHIELD data described below, we have access to the offending packet as well as the nature of the offense. The logs cover two separate periods: one period from July 1 to August 30, 2004 and the other from December 15, 2004 to January 15, 2005. The data exhibits a large amount of variation in the kind of attacks seen (over 100 different attack types) as well as the distribution of attacking IP addresses (over 100000 unique source addresses) and 40000 alerts/day/IDS.
(b) DSHIELD Logs: DSHIELD is a global repository set up as a research initiative as part of the SANS institute. Participating organizations provide IDS/firewall logs, which DSHIELD uses for detection and analysis of new vulnerabilities, and blacklist generation. Since the IDS systems which participate in DSHIELD employ widely varying software, DSHIELD uses a minimal record format for its logs and scrubs the high order 8 bits of the destination IP address, as shown in Figure 1b. The entities participating in DSHIELD vary in size from several Class B networks to smaller Class C networks and are distributed throughout the globe [28,2]. The logs are of substantial size with nearly 15000 alerts/day/IDS. We have collected DSHIELD logs from 1657 IDSs for the period from Dec. 15, 2004 to Jan. 15, 2005 corresponding to the ISP dataset.
(c) University Logs:
Finally, we collect a set of logs from IDS/firewall systems deployed at ![]() universities U1, U2 and U3. Of these we have
access to raw data complete with packet headers and nature of offense
detected in U1. The second university U2 provided us with logs from running the Bro IDS [19], but with protected addresses anonymized. The signature set
deployed is different and the alerts consist mostly of scans of IP addresses
as well as port-scans. The third university U3 provided us with firewall logs
which consisted of blocked connection attempts. The University logs generate 30000 alerts/day/IDS on the average.
universities U1, U2 and U3. Of these we have
access to raw data complete with packet headers and nature of offense
detected in U1. The second university U2 provided us with logs from running the Bro IDS [19], but with protected addresses anonymized. The signature set
deployed is different and the alerts consist mostly of scans of IP addresses
as well as port-scans. The third university U3 provided us with firewall logs
which consisted of blocked connection attempts. The University logs generate 30000 alerts/day/IDS on the average.
A few limitations are worth mentioning. Except for the ISP logs, the other IDSs in the logs are largely independent. We do not have access to their configurations, and hence we do not know the signature sets they employ, or even the platforms they use. This means that some of the attack correlation may be hidden because of differences between IDS signature sets. Second, we do not have information about the nature or the business of the protected networks, and thus cannot tell whether these issues play a role in attack correlation.
To carry out this study, we need to extract attacks from IDS logs. We consider
a stream of suspicious packets from the same source to an IDS with an inter-arrival
smaller than 10 minutes as an attack. Below we explain why a separation
window of ![]() minutes is reasonable.
minutes is reasonable.
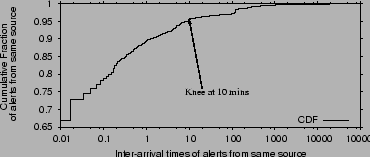 |
To find a meaningful separation window, we plot a CDF of inter-arrival times of
consecutive alerts from the same source at an IDS in
Figure 2. The CDF shows that ![]() of the alerts
from a source arrive within a minute of each other, these are likely to belong
to the same attack event. The knee in the CDF happens at
of the alerts
from a source arrive within a minute of each other, these are likely to belong
to the same attack event. The knee in the CDF happens at ![]() minutes,
inter-arrival times larger than
minutes,
inter-arrival times larger than ![]() minutes are spread out to several hours.
We pick
minutes are spread out to several hours.
We pick ![]() minutes as the window because about 95% of the
alerts from the same source arrive separated by less than 10 minutes and the
other 5% have widely-spread interarrivals.
minutes as the window because about 95% of the
alerts from the same source arrive separated by less than 10 minutes and the
other 5% have widely-spread interarrivals.
Attack correlation can be parameterized by the set of correlated header fields and the time window used to compute the correlation. We define two attacks to be correlated if they share the source IP address and start within 10 minutes of each other. Both choices are based on detailed analysis of the data that showed almost no sensitivity to including additional fields in the correlation beyond the source IP and using time windows larger than 10 minutes. Below we describe this analysis in detail.
 |
(a) Picking the correlation fields: Defining attack correlation based on the destination IP address is not useful since attacks seen by a particular IDS will have their destinations in the local network. Also the source port is likely to be picked randomly and is not useful for defining attack correlation.
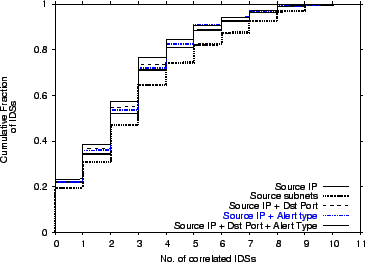
We consider the following definitions of correlated attacks: 1) source based, 2) source and the destination port combined, 3) source and alert type combined, 4) source, alert type, and destination port combined, 5) and source subnet based. We conduct this analysis for the ISP dataset and the U1 datasets, for which we have access to all these fields.
Since our main interest is to find who is correlated with whom, we consider how different attack correlation definitions affect the size of the correlation group of a IDS (see Table 1). Correlated groups are explained further in §3, but for the purposes of this analysis they are simply the set of IDSs with which a particular IDS shares correlated attacks.
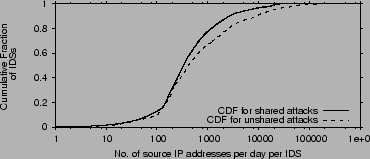
Figure 3 plots the cumulative distribution functions (CDFs) of the size of the correlation group of an IDS. Different CDFs correspond to different correlation fields. The figure shows that, except for the CDF for source subnets, all the other CDFs are very close together. Classification based on the attacking source subnet results in slightly higher correlation, but the difference is not substantial. Further, classifying based on source subnet carries the danger of blacklisting an entire subnet resulting in innocent sources being blocked. Since including extra fields in the definition of correlation in addition to the source IP has no significant impact on the correlation CDF, we define attack correlation based solely on the similarity of the offending source IP.
The above leads to an interesting result: performing attack correlation analysis requires minimal information, namely attack time and offending source IP.
(b) Picking the maximum time window between
correlated attacks:
Unless stated differently, a ![]() minute window is used for determining correlated
attacks at different IDSs. We tried different time windows in the
minute window is used for determining correlated
attacks at different IDSs. We tried different time windows in the ![]() minutes range. Windows less than
minutes range. Windows less than ![]() minutes resulted in
decreased attack correlation while there was not much
difference for windows greater than
minutes resulted in
decreased attack correlation while there was not much
difference for windows greater than ![]() .
Hence we picked the minimum window possible i.e.,
.
Hence we picked the minimum window possible i.e., ![]() minutes. Thus, if two attacks
at two IDSs start within
minutes. Thus, if two attacks
at two IDSs start within ![]() minutes of each other, then they are considered correlated.
minutes of each other, then they are considered correlated.
(c) Correlation threshold:
We say that two IDSs are correlated if more than ![]() of
their attacks are correlated. We justify the threshold below.
We compute the CDF of
correlation taken over all IDSs with non-empty groups
(i.e., IDSs that are correlated with at least one other IDS).
For 90% of the IDS, the correlation (percentage of correlated
attacks w.r.t all attacks) was higher than
of
their attacks are correlated. We justify the threshold below.
We compute the CDF of
correlation taken over all IDSs with non-empty groups
(i.e., IDSs that are correlated with at least one other IDS).
For 90% of the IDS, the correlation (percentage of correlated
attacks w.r.t all attacks) was higher than ![]() ranging upto
ranging upto ![]() .
For the remaining
.
For the remaining ![]() of the IDS, the correlation was slightly higher than
of the IDS, the correlation was slightly higher than ![]() .
Such small values are due to a few attacks being shared
and do not reflect any significant correlation between the two
IDSs.
.
Such small values are due to a few attacks being shared
and do not reflect any significant correlation between the two
IDSs.
 |
 |
 |
How long does it take a common attacker before he attacks the next
network? If this time is long then the exchange of alert data can be offline, but if it is short then effective collaboration against
common attackers requires realtime exchange of information.
We compute interarrival times of attacks from the same source
at multiple IDSs, i.e., the difference between when the first time the
attacker is observed at different IDSs.
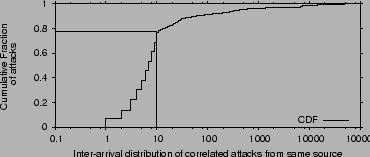
Figure 6 shows the CDF of these
interarrival times. More than
![]() of the time, a common attacker attacks the next IDS within
of the time, a common attacker attacks the next IDS within ![]() minutes
from the previous IDS. Attackers therefore mount multiple attacks within a span
of a few minutes, suggesting that collaborative detection of such
attackers has to be in realtime.
minutes
from the previous IDS. Attackers therefore mount multiple attacks within a span
of a few minutes, suggesting that collaborative detection of such
attackers has to be in realtime.
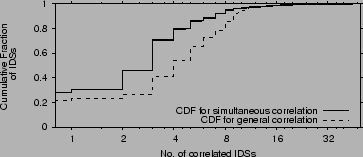
We plot in Figure 7 the CDF of the number of
IDSs with which an IDS is correlated (i.e., the size of its correlation
group) for all ![]() IDSs in our dataset. We consider two cases:
simultaneous correlation, in which two attacks are correlated
if they share the same source IP and happen within
IDSs in our dataset. We consider two cases:
simultaneous correlation, in which two attacks are correlated
if they share the same source IP and happen within ![]() minutes of each
other, and general correlation, in which two attacks are
correlated if they share the source IP.
The former helps detect distributed attacks, while the latter helps detect malicious
sources which should be blacklisted. General correlation is by definition
greater than simultaneous correlation. The figure shows that
on average each IDS is correlated with
minutes of each
other, and general correlation, in which two attacks are
correlated if they share the source IP.
The former helps detect distributed attacks, while the latter helps detect malicious
sources which should be blacklisted. General correlation is by definition
greater than simultaneous correlation. The figure shows that
on average each IDS is correlated with ![]() other IDSs, i.e.,
less than
other IDSs, i.e.,
less than ![]() of the total number of IDSs. Further, 96% of the
IDSs are correlated with less than
of the total number of IDSs. Further, 96% of the
IDSs are correlated with less than ![]() IDSs.
IDSs.
Note that the plots for simultaneous and general correlation are
fairly similar. Though the average number of IDSs with which an IDS shares attacks
increases to nearly ![]() , the CDF does not change much. Again, this shows that
when correlated attacks happen at different locations in the Internet, most likely
they happen with a short period.
, the CDF does not change much. Again, this shows that
when correlated attacks happen at different locations in the Internet, most likely
they happen with a short period.
 |
 |
We would like to examine how often the correlation group of an IDS changes. If the membership of the correlation group of an IDS is stable then each network can spend the time to identify its correlation group offline. Once the correlation group is identified, the actual exchange of alerts is done in realtime. On the other hand, if the members of an IDS' correlation group keep changing over short intervals, collaboration will be hard as it requires re-examining attack correlation and deciding in realtime whether to collaborate.
We need to define a measure of how a group of IDSs is
changing. We assign the IDSs consecutive IDs. For each IDS ![]() in our dataset, we create a correlation vector
in our dataset, we create a correlation vector ![]() whose
length is equal to the total number of IDSs in the dataset. We set
whose
length is equal to the total number of IDSs in the dataset. We set
![]() if IDS
if IDS ![]() is correlated with IDS
is correlated with IDS ![]() , and
, and ![]() otherwise based on the alerts they generate on day
otherwise based on the alerts they generate on day ![]() . For example,
. For example,
![]() means that IDS
means that IDS ![]() and IDSs 2,3, and 5
see correlated attacks on the 16th day in our dataset.
and IDSs 2,3, and 5
see correlated attacks on the 16th day in our dataset.
The difference vector for two days for a given IDS is the vector
obtained by subtracting the corresponding correlation vectors for those
days. For example, the difference
![]() indicates how
the correlation group of IDS
indicates how
the correlation group of IDS ![]() changes over a
period of 17 days, starting on day
changes over a
period of 17 days, starting on day ![]() in our logs.
in our logs.
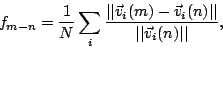
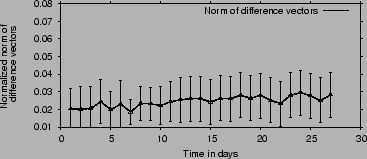
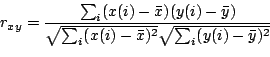
We measure the persistence of attack correlation as a function of time using the following metric:
Figure 8 plots our measure of the
difference in attack correlation ![]() as a function of time in days along with the standard deviation.
It shows that,
the correlation vector does not change significantly with
time.
In particular, on average the correlation vector changes by less than
as a function of time in days along with the standard deviation.
It shows that,
the correlation vector does not change significantly with
time.
In particular, on average the correlation vector changes by less than
![]() of its original value over a period that spans a whole month.
The insignificant change shows that correlation happens consistently
with the same group of IDSs and is persistent over time.
of its original value over a period that spans a whole month.
The insignificant change shows that correlation happens consistently
with the same group of IDSs and is persistent over time.
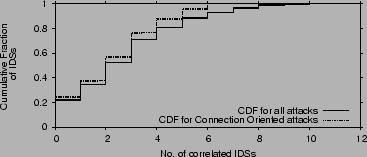 |
The correlation shown above considers all attacks, including those which could be from spoofed source addresses. Intuitively, one would expect that source spoofing does not affect the correlation structure as it is usually done randomly, and thus unlikely to create a well-defined structure. In order to estimate the effect of spoofed sources on our results we divide the logged attacks into two classes:
Figure 9 compares the correlation exhibited by the connection oriented attacks to that exhibited by the combination of all attacks. The figure plots the CDF of the size of the correlation group for each IDS for each kind of attack. The figure shows that the two CDFs are very close, indicating that the correlation structure is highly robust to source spoofing. Similarly, we have performed the correlation persistence test in §4.2 on connection oriented attacks and found the results to be compatible with those in §4.2.
 |
We consider the distribution of IDSs with which a particular IDS is
correlated. We compare this distribution in our data with the
corresponding distribution generated by random targeting.
We simulate random targeting as follows. We pick an IDS, ![]() , and look at
all of its correlated attacks. For each correlated attack, we replace
the set of IDSs with which IDS
, and look at
all of its correlated attacks. For each correlated attack, we replace
the set of IDSs with which IDS ![]() shares this attack with a
random set of IDSs of the same size. We repeat this process for each
attack at IDS
shares this attack with a
random set of IDSs of the same size. We repeat this process for each
attack at IDS ![]() . For each IDS
. For each IDS ![]() , where
, where ![]() , the number of correlated
attacks with
, the number of correlated
attacks with ![]() , after proper normalization, represents the probability that
IDS
, after proper normalization, represents the probability that
IDS ![]() is correlated with IDS
is correlated with IDS ![]() . We compare this probability
distribution in our data with the one generated by random attack targeting.
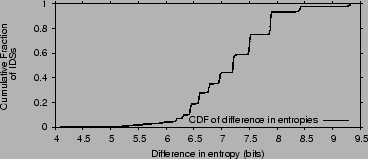
In our data, this distribution is highly biased, i.e., an IDS
. We compare this probability
distribution in our data with the one generated by random attack targeting.
In our data, this distribution is highly biased, i.e., an IDS ![]() is correlated with a few other IDSs and uncorrelated with the rest of IDSs. Since we are
interested in measuring how far our data is from random targeting, we
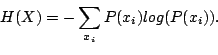
compare the entropy of the two distributions. The entropy of the
distribution of a random variable
is correlated with a few other IDSs and uncorrelated with the rest of IDSs. Since we are
interested in measuring how far our data is from random targeting, we
compare the entropy of the two distributions. The entropy of the
distribution of a random variable ![]() is:
is:
 |
(2) |
So why two IDSs share correlated attacks? We investigate two possible reasons: 1) closeness in the protected IP space, 2) similarity in the software and services run on the two sites. Our results show that the latter is the likely reason of attack correlation between two IDSs.
(a) Closeness in IP space: Some attackers employ scanning techniques to discover vulnerabilities. They start from a randomly selected IP and then scan sequentially. If the scanned address spaces belong to different sites, the IDS at the respective sites are likely to show attack correlation. Thus, closeness in the IP space could be a reason for attack correlation.
We compute the distance between two prefixes ![]() and
and ![]() of equal length as
the decimal value of the bit-string produced by taking
of equal length as
the decimal value of the bit-string produced by taking ![]() of
of ![]() and
and ![]() .
If the prefixes are of unequal length, the shorter prefix is bit-shifted to the
left to equalize the lengths. The distance in IP space between two IDSs
.
If the prefixes are of unequal length, the shorter prefix is bit-shifted to the
left to equalize the lengths. The distance in IP space between two IDSs ![]() and
and
![]() ,
, ![]() , is defined as the IP distance between their protected
address prefixes.
Also for each IDS pair we generate the vector of correlation
, is defined as the IP distance between their protected
address prefixes.
Also for each IDS pair we generate the vector of correlation
![]() , where
, where ![]() is the percentage of attack at
is the percentage of attack at ![]() which are correlated with some attacks at
which are correlated with some attacks at ![]() .
If proximity in the IP space is a reason for attack correlation, then
the more the distance between IDSs
.
If proximity in the IP space is a reason for attack correlation, then
the more the distance between IDSs ![]() and
and ![]() is, the less likely
they share correlated attacks-i.e.,
is, the less likely
they share correlated attacks-i.e., ![]() and
and ![]() should be inversely correlated. Thus, we compute the cross
correlation between these two vectors.
Note that a cross correlation around zero means independence.
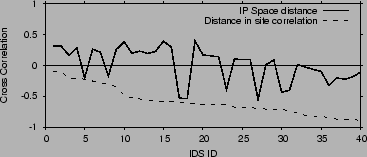
Figure 11 plots the cross correlation between
attack correlation and distance in IP space.
The x-axis is the IDS id.
Note that the correlation with IP space
hovers around zero, indicating that attack correlation is independent
from the distance in IP space.
Thus, having nearby IP prefixes does not have a visible impact on
sharing correlated attacks.
should be inversely correlated. Thus, we compute the cross
correlation between these two vectors.
Note that a cross correlation around zero means independence.
Figure 11 plots the cross correlation between
attack correlation and distance in IP space.
The x-axis is the IDS id.
Note that the correlation with IP space
hovers around zero, indicating that attack correlation is independent
from the distance in IP space.
Thus, having nearby IP prefixes does not have a visible impact on
sharing correlated attacks.
(b) Similarity in Software and Services: Small correlation groups may be due to recent attack trends. In particular, two IDSs may share correlated attacks because they are on a single hit list, or they run software or a service that is targeted by the common attacker. For example, the Santy worm uses a vulnerability in popular phpBB discussion forum software to spread and uses a search engine to find vulnerable servers [6].
Unfortunately, except for the university logs (U1), we do not know the identity of the protected networks, the type of software they run, or the services they provide, and hence cannot check attack correlation against that information. Instead we perform two indirect tests.
First, we have examined the correlated attacks in each group for the case of the ISP data where full attack details are available. Indeed, except for one correlation group, each group seems to focus on a specific shared attack, i.e., more than 60% of the correlated alerts in that group are of a particular type. There are SMTP groups, NT groups, IIS groups, etc. This should not be surprising as recent attacks obtain a list of networks that run a software with the targeted vulnerability via a search engine or other ways and send only to those sites [6].
Second, we try to indirectly infer the
software and services run on the correlated networks by comparing the
type of alerts they generate. We compute the distribution of alert
types generated by each network and compare them against each
other. We divide alerts into ![]() broad categories: alerts due to
attacks on DNS servers, web servers, ftp, RPC services, Windows Server 2003, servers
running RPC, mail servers, servers using SQL (both MS and MySQL), telnet and
ssh servers, attacks on routers, IRC servers, CIFS (SMB) servers and
miscellaneous. We compute the fraction of alerts of each type in the IDS log.
We consider this distribution to be characteristic of the network itself, and
check whether attack correlation is correlated with correlation in this
distribution.
broad categories: alerts due to
attacks on DNS servers, web servers, ftp, RPC services, Windows Server 2003, servers
running RPC, mail servers, servers using SQL (both MS and MySQL), telnet and
ssh servers, attacks on routers, IRC servers, CIFS (SMB) servers and
miscellaneous. We compute the fraction of alerts of each type in the IDS log.
We consider this distribution to be characteristic of the network itself, and
check whether attack correlation is correlated with correlation in this
distribution.
We express the alert distribution in a vector ![]() with
with
![]() elements. For example,
elements. For example,
![]() means
that
means
that ![]() of the alerts generated by IDS
of the alerts generated by IDS ![]() are of category 1,
etc. We measure the distance between the alert distributions at IDS
are of category 1,
etc. We measure the distance between the alert distributions at IDS
![]() and
and ![]() by the difference
by the difference
![]() , where
, where ![]() is the Euclidean norm.
Similarly to the analysis in §4.5(a), we compare
is the Euclidean norm.
Similarly to the analysis in §4.5(a), we compare ![]() with
with ![]() , where
, where ![]() is the percentage of attack at
is the percentage of attack at ![]() which are correlated with some attacks at
which are correlated with some attacks at ![]() .
If similar software and services are reasons for attack correlation,
then
.
If similar software and services are reasons for attack correlation,
then ![]() and
and ![]() should be inversely correlated.
We compute the cross correlation between these two vectors.
Note that a cross correlation around zero means independence.
whereas a negative cross correlation means that an increase in
the distance,
should be inversely correlated.
We compute the cross correlation between these two vectors.
Note that a cross correlation around zero means independence.
whereas a negative cross correlation means that an increase in
the distance, ![]() , is correlated with a decrease in attack
correlation
, is correlated with a decrease in attack
correlation ![]() .
Figure 11 plots the cross correlation between
attack correlation and our indirect measurement of the similarity of
the software and services on the protected networks.
Note that attack correlation is
negatively correlated with our measure of the distance between the
software and services on the protected networks-i.e.,
an increase in this distance results in a decrease in correlation.
Thus, it seems that one origin of attack correlation across different networks is
the similarity in the software and services they run.
.
Figure 11 plots the cross correlation between
attack correlation and our indirect measurement of the similarity of
the software and services on the protected networks.
Note that attack correlation is
negatively correlated with our measure of the distance between the
software and services on the protected networks-i.e.,
an increase in this distance results in a decrease in correlation.
Thus, it seems that one origin of attack correlation across different networks is
the similarity in the software and services they run.
 |
We exploit the structure of attack correlation to solve the above two
problems. We propose a correlation-based method for picking
collaborators. By exchanging alert data with only those IDSs in its
correlation group, an IDS minimizes the overhead of the collaboration
while maximizing its chances of detecting common attackers. Furthermore,
since the size of a correlation group is small and its membership is
stable, an IDS can check using out-of-band mechanisms the reputability of
each of the IDSs in its correlation group. It can use this information to
decide whether to collaborate. If needed, the IDS can use legal contracts
to enforce trust and privacy. If the IDSs choose to collaborate, they use
a secure channel to exchange information so that eavesdroppers cannot
snoop.
IDSs need to know which other IDSs are in their correlation group. We envision
a number of non-profit organizations (like CERT and DSHIELD) and commercial
entities that discover attack correlation across IDSs and report to each network
the identity of the other networks in its correlation group. We call these
entities Attack Correlation Detectors (ACD). A network may participate in one
or more ACDs. The choice of ACD may depend on the number and types of networks
participating in the ACD, its reputation, etc. The ACD occasionally collects
logs from participant IDSs. The logs cover a particular period that can be as
small as a single day randomly chosen by the ACD. The logs have minimal
sensitive information. Each record in the log provides the following fields:
(Time, Source IP, Packet Count). Our analysis
in §2.2.3 shows that these fields are enough for
detecting attack correlation. The ACD performs the correlation analysis and
informs each network of its correlation group, expressed as a list of the
following records: (correlated IDSs, level of correlation).
The correlation analysis is not intensive, the average time taken to analyze a days
worth of logs is just ![]() hours on an Intel Itanium
hours on an Intel Itanium ![]() GHz SMP machine with
GHz SMP machine with ![]() GB of memory.
Further since IDS correlation is persistent
over atleast a month, the analysis is repeated only after such long periods
of time. Once organizations know their correlation group, they can independently decide with whom to collaborate, basing
their decisions on the level of correlation and the identity of the peer
network.
GB of memory.
Further since IDS correlation is persistent
over atleast a month, the analysis is repeated only after such long periods
of time. Once organizations know their correlation group, they can independently decide with whom to collaborate, basing
their decisions on the level of correlation and the identity of the peer
network.
Integrating new IDSs and updating participant IDSs about changes in their correlation can be performed incrementally. A new IDS provides logs from the same collection point so that its correlation group can be found. Updates are incremental, since IDSs need to be informed only if their correlation group changes. Due to the persistence of membership in these correlation groups (a month or more), the update process can be performed in a lazy fashion with the cost amortized over long periods of time.
It should be noted that acting as an ACD is relatively simple. Indeed, DSHIELD already has the means to provide this service to its participant networks.
(b) Privacy: Recall that for discovering its correlation group an IDS provides the ACD with logs of attacking IP addresses, alert time, and packet count. Thus, none of the sensitive alert fields such as the attack type, the destination, and the destination port, are needed. Also the data is revealed only to the ACD and does not get published. On the other hand, privacy of the data exchanged with one's collaborators is provided largely because IDSs have the ability to independently decide which IDSs to collaborate with, and what to reveal. Further, the persistence of correlation allows the collaborators to use legal contracts to protect their data, if necessary.
(c) Protecting against spreading lies: An IDS that lies about its attackers to the ACD does not harm the system. Such lies are unlikely to be correlated with any of the attacks seen at other IDSs, even if they do, each IDS checks independently the credential of each of its collaborators before sharing any alert data with them. Lying to one's collaborators is unlikely as their reputations are carefully checked and information exchange is protected by legal contracts.
We present a rough evaluation of the overhead and the enhancement in detection capability obtained via various choices of collaborating IDSs for detecting correlated attacks. We compare the following 4 schemes for picking collaborators:
In order to compare the above schemes, we need to specify a protocol for exchanging alerts and processing the acquired information. We use the simple approach described below. This approach is not necessarily optimal, but it suffices to evaluate the relative benefits of the different methods of picking collaborators.
The IDSs collaborate to detect low rate attackers and speed up the detection of moderate rate attackers. Each IDS maintains a Blacklisting Threshold and a Querying Threshold. A source IP address is blacklisted when the number of suspicious packets from it crosses a Blacklisting Threshold. An IDS queries its collaborators when the number of malicious packets from a source IP address crosses the Querying Threshold. If the aggregate rate of the offending source at all collaborators exceeds the Blacklisting Threshold the source is blacklisted. Once a source is blacklisted it is set apart for further investigation and an alarm is triggered to all collaborators.
The time taken to blacklist a source depends on two factors; the rate at which the source is attacking as well as the chosen Blacklisting Threshold. In picking a particular threshold, there is an inherent tradeoff between false positive ratio and false negative ratio. A low Blacklisting Threshold will result in a high false positive ratio while a high threshold will miss many moderate rate attacks resulting in a high false negative ratio. The right value for the Blacklisting Threshold is site specific and should be picked to optimize the false negative and false positive ratios.
We use the ISP and U1 datasets to find a good value for the thresholds because
these logs contain enough information to distinguish many cases of false
positives. We set the Blacklisting Threshold to ![]() malicious
packets/day because in our dataset, this rate results in a false positive ratio
less than 1%. We set the Querying Threshold to
malicious
packets/day because in our dataset, this rate results in a false positive ratio
less than 1%. We set the Querying Threshold to ![]() malicious
packets/day. The Querying Threshold has to be substantially lower than
the Blacklisting Threshold, but there is nothing special about the value
of 50 packets/day. In reality, these thresholds will vary depending on the
local sites configuration as well as the nature of the alert itself. The above
thresholds seem reasonable for those IDSs in our dataset for which we have
detailed attack information.
malicious
packets/day. The Querying Threshold has to be substantially lower than
the Blacklisting Threshold, but there is nothing special about the value
of 50 packets/day. In reality, these thresholds will vary depending on the
local sites configuration as well as the nature of the alert itself. The above
thresholds seem reasonable for those IDSs in our dataset for which we have
detailed attack information.
To simulate the attacks, we replay the traces in our datasets. We divide one
month worth of traces into two equal parts, corresponding to ![]() days each.
The correlation groups are generated from one set (the training set), while
the various schemes for picking collaborators are tested on the other set (the
test set).
days each.
The correlation groups are generated from one set (the training set), while
the various schemes for picking collaborators are tested on the other set (the
test set).
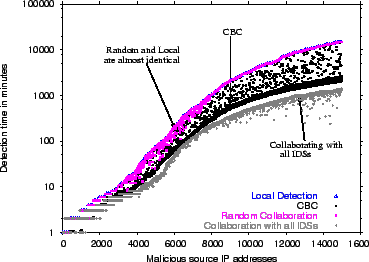 |
Figure 12 plots the time it takes to blacklist a source in each of the four approaches: CBC, Local Detection, Random Collaboration and Collaboration with All IDSs.
The time to blacklist a source is defined as the time difference between the instant the source is blacklisted by some IDS and the instant the source was first detected by any of the collaborators. The plots
are only for sources detected at more than ![]() IDS, because
localized sources always require the same time to detect under all four schemes.
The malicious sources on the
IDS, because
localized sources always require the same time to detect under all four schemes.
The malicious sources on the ![]() axis are sorted according to their detection time by Local Detection. Note that for this
figure, we set Blacklisting Threshold to a total of
axis are sorted according to their detection time by Local Detection. Note that for this
figure, we set Blacklisting Threshold to a total of ![]() packets, rather than
packets, rather than ![]() packet/day, so that each approach will eventually detect the malicious source.
packet/day, so that each approach will eventually detect the malicious source.
The figure shows that, for fast sources which can be detected locally in ![]() minutes or less, there is no significant difference among the four schemes.
These form nearly
minutes or less, there is no significant difference among the four schemes.
These form nearly ![]() of all classified common attackers. The curves
diverge for slower sources which take longer to blacklist locally. Random
collaboration offers no benefit, i.e., the time taken to blacklist is the same
as Local Detection except for a few sources. In contrast, CBC speeds up
detection for about
of all classified common attackers. The curves
diverge for slower sources which take longer to blacklist locally. Random
collaboration offers no benefit, i.e., the time taken to blacklist is the same
as Local Detection except for a few sources. In contrast, CBC speeds up
detection for about ![]() of the studied sources, and performs nearly as well
as collaborating with all IDSs. There are a small number around
of the studied sources, and performs nearly as well
as collaborating with all IDSs. There are a small number around ![]() of slower
sources which take longer to detect in CBC because of them being correlated
across IDSs which do not belong to each other's correlation group.
of slower
sources which take longer to detect in CBC because of them being correlated
across IDSs which do not belong to each other's correlation group.
|
Faster detection of malicious sources also results in
significant reduction in alert volume. Table 3 lists the
average reduction in alert volume from blacklisting under CBC, Random
Collaboration, Collaborating with all IDSs and Local Detection. On average,
CBC results in ![]() reduction in alert volume (i.e., the size of the log
that admin should examine). The value is close to the one obtained by
collaborating with all IDSs, which is
reduction in alert volume (i.e., the size of the log
that admin should examine). The value is close to the one obtained by
collaborating with all IDSs, which is ![]() . Local Detection, on the
other hand, performs significantly worse; it reduces the alert volume only by
. Local Detection, on the
other hand, performs significantly worse; it reduces the alert volume only by
![]() . There is no discernible difference between Local Detection and
Random Collaboration, the reduction in alert volume is only marginally better at
. There is no discernible difference between Local Detection and
Random Collaboration, the reduction in alert volume is only marginally better at ![]() .
The above numbers are for all attacks, correlated and uncorrelated. Thus by being able to quickly detect correlated attacks,
CBC reduces alert volume by a further
.
The above numbers are for all attacks, correlated and uncorrelated. Thus by being able to quickly detect correlated attacks,
CBC reduces alert volume by a further ![]() over Local Detection.
over Local Detection.
Table 3 also lists the fraction of correlated malicious sources
missed by CBC, Local Detection, and Random Collaboration in comparison to
Collaborating with all IDSs. A malicious source is missed if the scheme is
unable to blacklist it due to incomplete information, though it is blacklisted
all IDSs collaborate. CBC misses only ![]() of
the malicious sources, while Local Detection misses
of
the malicious sources, while Local Detection misses ![]() of them.
Random collaboration scheme is almost similar at
of them.
Random collaboration scheme is almost similar at ![]() . These
values depend on the thresholds used, but they demonstrate the
order of magnitude improvement obtained in CBC and the insignificant
difference between CBC and collaborating with all IDSs. In summary, CBC
improves significantly over Local Detection. It increases the number of
detected sources by
. These
values depend on the thresholds used, but they demonstrate the
order of magnitude improvement obtained in CBC and the insignificant
difference between CBC and collaborating with all IDSs. In summary, CBC
improves significantly over Local Detection. It increases the number of
detected sources by ![]() , and reduces the volume of alerts by an extra 38%
beyond Local Detection. It performs almost as well as the collaborating with
all IDSs. In contrast, a random choice of collaborators is as bad as not
collaborating.
, and reduces the volume of alerts by an extra 38%
beyond Local Detection. It performs almost as well as the collaborating with
all IDSs. In contrast, a random choice of collaborators is as bad as not
collaborating.
Several proposals exist for building collaborative and distributed intrusion detection systems [21,9,10,26,20,23,22,8,28], but none of them has studied attack correlation. Our work extends many of these proposals with a mechanism for picking collaborators, and maximizes the benefit of collaboration while limiting its overhead.
Early distributed intrusion detection systems collect audit data from distributed component systems but analyze them in a central place (e.g., DIDS [21], ISM [9], NADIR [10], NSTAT [26] and ASAX [8]). Recent systems have paid more attention to scalability (e.g., EMERALD [20], GrIDS [23], AAFID [22], and CSM [27]). We discuss a few of them below.
The Collaborative Intrusion Detection System [14] involves dynamic groups of nodes that rapidly change and exchange information. The set of nodes exchanging information is not constant and is changed continuously to cover all nodes in the system which limits its scalability. COSSACK [11], another collaborative response framework, is concerned more with alarm propagation than detection itself. DOMINO [28] relies on a hierarchy of nodes with different levels of trust and aims to exchange blacklist information. The nodes are placed such that IDSs protecting networks with close destination address spaces are close together.
The Distributed Intrusion Detection System (DIDS) [21] addresses system attacks across a network. Attacks such as doorknob, chaining, and loopback could be detected when data from hosts within a given network was combined under centralized control. Clever attackers could still subvert DIDS by reducing the volume of attacks for a given network.
EMERALD addresses intrusions within large separately administered networks [20]. EMERALD includes features for handling different levels of trust between the domains from the standpoint of a centralized system: individual monitors are deployed in a distributed fashion, but still contribute to a high-level event-analysis system. EMERALD appears to scale well to large domains. The Hummer project [15] focuses on the relationships between different IDSs (e.g., peer, friend, manager/subordinate relationships) and policy issues (e.g., access control, cooperation policies).
Finally, there has been work on specification and event abstraction to allow multiple IDS boxes to share attack information and collaborate on detection and protection [5,24,7].
Attack Measurements & Analysis: A lot of work has been done in characterizing attack characteristics. Yegneswaran et al. [28,18] study the global characteristics of intrusions as well as Internet background radiation. Network telescopes are used to study DoS activity in [17]. Placement of blackholes in a distributed Internet setting for global threat detection is addressed in [3].
Analysis of Intrusion Alerts: GrIDS [23] collects traffic and connections data. It analyzes TCP/IP network activities using activities graphs and reports anomalies when activity exceeds an user specified threshold. Methods of discovering intent by correlating alerts from different IDSs are presented in [12]. Algorithms for sharing of alerts [13] in a privacy-preserving manner could be a future avenue of research. Alert correlation to reduce the number of alerts to be manually examined is discussed in [4]. Alerts are inserted into a relational database to be aggregated and the summarized alert is presented to the operator. These are orthogonal to our work and can be easily integrated.
Our results also show that the ![]() IDSs can be grouped into
small correlation groups of 4-6 IDSs; two IDSs in the same correlation
group share highly correlated attacks, whereas IDSs in different correlation
groups see almost no correlated attacks. Furthermore, the correlation
groups are stable and their membership persists for months. Though not conclusive,
our analysis
indicates that similarity in the software and services running on the protected
networks causes their IDSs to show attack correlation.
IDSs can be grouped into
small correlation groups of 4-6 IDSs; two IDSs in the same correlation
group share highly correlated attacks, whereas IDSs in different correlation
groups see almost no correlated attacks. Furthermore, the correlation
groups are stable and their membership persists for months. Though not conclusive,
our analysis
indicates that similarity in the software and services running on the protected
networks causes their IDSs to show attack correlation.
Our empirical results have important implications for collaborative intrusion
detection of common attackers. They show that it is quite important that each
network/IDS picks the right collaborators. Exchanging alerts with thousands of
IDSs in realtime is impractical because of the resulting overhead and the lack
of trust between these networks. Using a trace-driven simulation, we show
that picking at random a smaller and fixed set of collaborators has almost no
benefits beyond local detection. In contrast, collaborating with the 4-6 IDSs
in one's correlation group has almost the same utility as collaborating with
all ![]() IDSs in our dataset with
IDSs in our dataset with ![]() times less overhead.
times less overhead.
Finally, we note that our results reflect the state of the Internet at the end of 2004 and the beginning of 2005. It is hard to predict the extent of attack correlation in the future and the continuous existence of correlation groups. Future research should investigate these characteristics and track their evolution.
This document was generated using the LaTeX2HTML translator Version 2002-2-1 (1.71)
Copyright © 1993, 1994, 1995, 1996,
Nikos Drakos,
Computer Based Learning Unit, University of Leeds.
Copyright © 1997, 1998, 1999,
Ross Moore,
Mathematics Department, Macquarie University, Sydney.
The command line arguments were:
latex2html -split 0 -show_section_numbers -local_icons paper.tex
The translation was initiated by Sachin Katti on 2005-08-12
|
Last changed: 22 Sept. 2005 aw |