Understanding Customer Problem Troubleshooting from Storage System Logs

Weihang Jiangf, Chongfeng Huf, Shankar Pasupathyf, Arkady Kanevskyf, Zhenmin Li§, Yuanyuan Zhouf

f University of Illinois
{wjiang3,chu7,yyzhou}@cs.uiuc.edu
f NetApp, Inc.
{shankarp,arkady}@netapp.com
§ Pattern Insight, Inc.
zhenmin.li@patterninsight.com


Abstract

Customer problem troubleshooting has been a critically important issue for both customers and system providers. This paper makes two major contributions to better understand this topic.
First, it provides one of the first characteristic studies of customer problem troubleshooting using a large set (636,108) of real world customer cases reported from 100,000 commercially deployed storage systems in the last two years. We study the characteristics of customer problem troubleshooting from various dimensions as well as correlation among them. Our results show that while some failures are either benign, or resolved automatically, many others can take hours or days of manual diagnosis to fix. For modern storage systems, hardware failures and misconfigurations dominate customer cases, but software failures take longer time to resolve. Interestingly, a relatively significant percentage of cases are because customers lack sufficient knowledge about the system. We observe that customer problems with attached system logs are invariably resolved much faster than those without logs.
Second, we evaluate the potential of using storage system logs to resolve these problems. Our analysis shows that a failure message alone is a poor indicator of root cause, and that combining failure messages with multiple log events can improve low-level root cause prediction by a factor of three. We then discuss the challenges in log analysis and possible solutions.

1  Introduction

1.1  Motivation

There has been a lot of effort, both academic and commercial [12,22,29,35,36,46], put into building robust systems over the past two decades. Despite this, problems always occur at customer sites. Customers usually report such problems to system vendors who are then responsible for diagnosing and fixing the problems. Rapid resolution of customer problems is critical for two reasons. First, failures in the field result in costly downtime for customers. Second, these problems can be very expensive for system vendors in terms of customer support personnel costs.
A recent study indicates that problem diagnosis related activity is 36-43% of TCO (total cost of ownership) in terms of support costs [17]. Additionally, downtime can cost a customer 18-35% of TCO [17]. The system vendor pays a price as well. A survey showed that vendors devote more than 8% of total revenue and 15% of total employee costs on technical support for customers [52]. The ideal is to automate problem resolution, which can occur in seconds and essentially costs $0.
Unfortunately, customer problem troubleshooting is very challenging because modern computing environments consist of multiple pieces of hardware and software that are connected in complex ways. For example, a customer running an application, which uses a database on a storage system, might complain about poor performance, but without sophisticated diagnostic information, it is often difficult to tell if the root cause is due to the application, network switches, database, or storage system. Individual components such as storage systems are themselves composed of many interconnected modules, each of which has its own failure modes. For example, a storage system failure can be caused by disks, physical interconnects, shelves, RAID controllers, etc [4,5,27,47,28]. Furthermore a large fraction of customer problems tend to be human generated misconfiguration [46] or operator mistakes [43].
In all these cases, there is a problem symptom (e.g. system failure) and a problem root cause (e.g. disk shelf failure). The goal of customer problem troubleshooting is to rapidly identify the root cause from the problem symptom, and apply the appropriate fix such as a software patch, hardware replacement or configuration correction. In some cases the fix is simply to clear a customer's wrong expectation.
It is standard practice for software and hardware providers today to build-in the capability to record important system events in logs [51,44]. Despite the widespread existence of logs, there is limited research on the use of logs to troubleshoot system misbehavior or failures. For IP network systems, some fault localization studies use log events to observe the network link failures, while the core diagnosis algorithms rely on the dependency models describing the relationship between link failures and network component faults [32,30,3]. For other systems, such a priori knowledge is usually lacking. Other research using logs deals with intrusion detection and security auditing [1,19]. In industry, Loglogic [39] and Splunk [25] provide solutions to help mine logs for patterns or specific words. While useful, they do not automate system fault diagnosis.
In this paper, we explore the use of storage system logs to troubleshoot customer problems. We start by characterizing the nature of customer problems, and measuring problem resolution time with and without logs (Sections 2 and 3). We then evaluate the extent to which a problem symptom alone can help narrow the possible cause of the problem (Section 4). Finally, we study the challenges in using logs to accurately obtain problem root cause information (Section 5) and briefly outline some ideas we have for automated log analysis (Section 5.3). We are currently evaluating these ideas in a system we are building for fully automated customer troubleshooting from logs.

1.2  Our Findings

Providing meaningful, quantitative answers to the questions we want to explore is a challenging task since it requires analysis of hundreds or thousands of real world customer cases and system logs. We speculate the lack of availability of such a data set is one of the reasons for the absence of studies in this area.
We had access to three structured databases at NetApp containing a wealth of information about customer cases, relevant system logs, and engineering analysis of the customer problems.
Using this data, our work makes two major contributions. First, it provides one of the first characteristic studies of customer problem troubleshooting using a large set (636,108) of real world cases from 100,000 commercially deployed storage systems produced by NetApp. We study the characteristics of customer problem troubleshooting from various dimensions including distribution of root causes, impact, problem resolution time as well as correlation among them. We evaluate the feasibility and challenges of using logs to resolve customer problems and outline a potential automatic log analysis technique.
simple_case.png
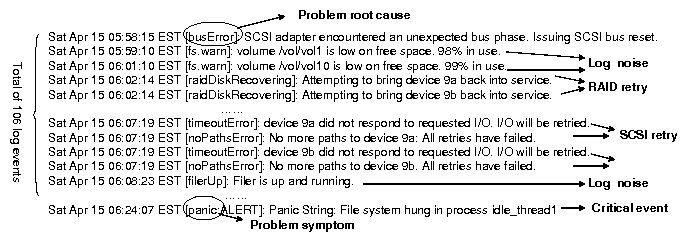
Figure 1: A sample asup message log. The problem symptom is a panic. The root cause is a SCSI bus bridge error. For this root cause, the log has some noise, i.e. events that are not connected with this case.
We have the following major findings:
(1) Problem troubleshooting is a time-consuming and challenging task. While we observed that 36% of reported problems are benign and automatically resolved, the remainder required expensive manual intervention that can take a long time.
(2) Hardware failures (40%) and misconfigurations (21%) dominate customer cases. Software bugs account for a small fraction (3%) but can cause significant downtime and take much longer to resolve.
(3) A significant percentage of customer problems (11%) are because customers lack sufficient knowledge about the system, which leads to misconfiguring the operating environment.
(4) More than 87% of problems have low impact because they are handled by built-in failure tolerance mechanisms such as RAID-DP [16]. While high-impact problems are much fewer, they are much more difficult to troubleshoot due to complex interactions between system modules and the multiple failure modes of these modules.
(5) An important finding is that customer cases with available system log messages invariably have a shorter (16-88%) problem resolution time than cases that don't have logs.
(6) Critical events in logs, which capture the failure symptoms, can help identify the high-level problem category, such as hardware problem, misconfiguration problem, etc. However, on their own, critical events are not enough to identify a more precise problem root cause which is necessary to resolve the customer problem.
(7) Combining critical events with multiple other log events can improve the problem root cause prediction by 3x, except for misconfigurations which tend to have too many noisy, unrelated log events.
(8) Logs are challenging to analyze manually. They contain a lot of log noise, due to messages logged by modules that are not related to the problem. Often log messages are fuzzy as well. This calls for an intelligent log analysis tool to filter out log noise and accurately capture a problem signature.
While we believe that many of our findings can be generalized to other system providers, especially storage system providers, we would still like to caution readers to take our dataset and evaluation methodology into consideration when interpreting and using our results.

2  Data Sources and Methodology

In this section, we describe how customer cases are created and resolved, and the use of system logs in this process. We also discuss how we select case and log data for analysis.

2.1  The AutoSupport System

The AutoSupport system [33] consists of infrastructure built into the operating system to log system events and to collect and forward these events to a database. While customers can choose if they want to forward these messages to the storage company, in practice most do so since it allows for proactive system monitoring and faster customer support.
Asup messages (autosupport messages) are sent both on a periodic basis and also when critical events occur. Periodic messages contain aggregated information for the week such as average CPU utilization, number of read and write I/Os, ambient temperature, disk space utilization etc. Critical events consist of warning messages or failure messages. Warnings, such as a volume being low on space, can be used for proactive resolution. A failure message, such a system panic or disk failure is diagnosed and fixed, after it is reported.
Every asup message contains a unique id that identifies the system that generated the message, the reason for the message, and any additional data that can help such as previously logged system events, system configuration etc.

2.2  An Example Scenario and Terminology

Figure 1 shows a sample asup message log. At the very end of the log is a critical event which is a message showing there was a file system panic that halted the system. Critical events can be either failure messages or warning messages. The critical event contains a problem symptom, in this case the system panic, which is what the customer observes as the problem.
Notice that every module in the system logs its own messages, and this is part of what makes log analysis very difficult. There is often a lot of log noise, which is what we call log messages that are not relevant to the current problem. As we see in Figure 1, there are over 100 messages in a short span of time, most of which are not relevant to the problem symptom.
In this example, we see that various components below the file system, including, the RAID and the SCSI layer, log their own failure messages. From our analysis, we determined that the problem root cause was a SCSI bus failure which is logged 106 events before the problem symptom.
Therefore, manually inspecting these logs can be time consuming. Furthermore, manual inspection requires a good understanding of the interactions between various software layers. In this example, the person resolving the case from logs would need to realize that the SCSI bus failure makes disks unavailable which in turn caused the file system to panic to prevent further writes that could not be safely written to disk.
autosupport.png
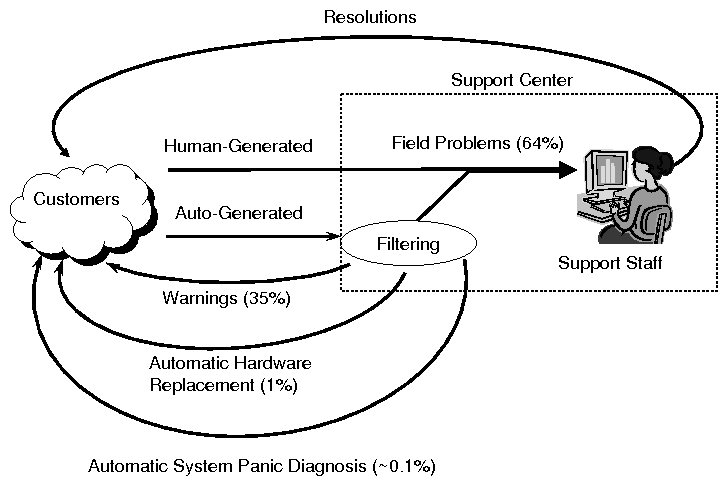
Figure 2: Flowchart of the customer support system

2.3  How Customer Cases are Created

Customer cases are created either automatically or manually. For every asup message that is received by the company, a rule-engine is applied to determine if a customer case should be created in the customer support database. We refer to these cases as auto-generated cases. Such cases have a problem symptom, which is the asup failure or warning message that led to the case being opened. For example, a system panic is a symptom that always results in the creation of a customer case.
Human-generated cases are those that are created directly by the customer, either over the phone or by email. These often include performance problems which are difficult to detect and log automatically.
Figure 2 illustrates how customer cases are generated and resolved in the customer support system.

2.4  Customer Case Resolution

Auto-generated customer cases are either manually resolved or automatically resolved. In Figure 2, 35% of customer cases are filtered out by the system since they are warnings that have no immediate customer impact. For 1% of customer cases, for example a disk failure, the resolution is to automatically ship a replacement part. 0.1% of customer cases are system panics that were automatically resolved by comparing the panic message and stack back traceto a knowledge-base and pointing the customer to appropriate fix.
In our study, we focus only on human-generated and auto-generated cases that are manually resolved since these are the ones that are most expensive both in terms of downtime and financial cost to the customer and the storage system company.

2.5  Data Selection

We now describe how we selected customer case data for analysis in later sections of this paper. There are two primary databases that were used. The first is a Customer Support Database that contains details on every customer case that was human-generated or auto-generated. Certain problems that cannot be resolved by customer support staff are escalated to engineering teams, who also record such problems in an Engineering Case Database.
We analyzed 636,108 customer cases from the Customer Support Database over the period 1/1/2006 to 1/1/2008. Of these 329,484 customer cases were human-generated and 306,624 customer cases were auto-generated. Overall these represent about 100,000 storage systems.
For each of these 636,108 customer cases, problem category and resolution time are retrieved from the Customer Support Database. For each of the 306,624 auto-generated customer cases, we also retrieved the critical event that led to the creation of the case. However, the human-generated cases do not have such information.
The goal for resolving any customer case is to determine the problem root case as soon as possible. Since such information in the Customer Support Database is unstructured, it was difficult to identify problem root cause for solved cases. However, the Engineering Case Database records problem root cause at a fine level. We used 4,769 such cases that were present in both the Customer Support as well as Engineering Case database to analyze problem root cause and its correlation with critical events.
To study the correlation between problem root cause and storage system logs, we retrieve the AutoSupport logs from the AutoSupport Database. Since not all customer systems send AutoSupport logs to the company, among 4,769 customer cases, 4,535 customer cases have corresponding AutoSupport log information.

2.6  Generality of our study

Although our study is based on customer service workflow at NetApp, we believe it is quite representative. As defined in ITIL [57], this customer service workflow represents a typical troubleshooting sequence: a problem case is opened by a call to the help center or by an alert generated by a monitoring system, followed by diagnosis by support staff. A similar process is followed by IBM customer service as described in [24]. Moreover, the comprehensive environment of the storage systems, gives us an opportunity to study a mixture of hardware, software and configuration problems.
time_cdf_vantive.png
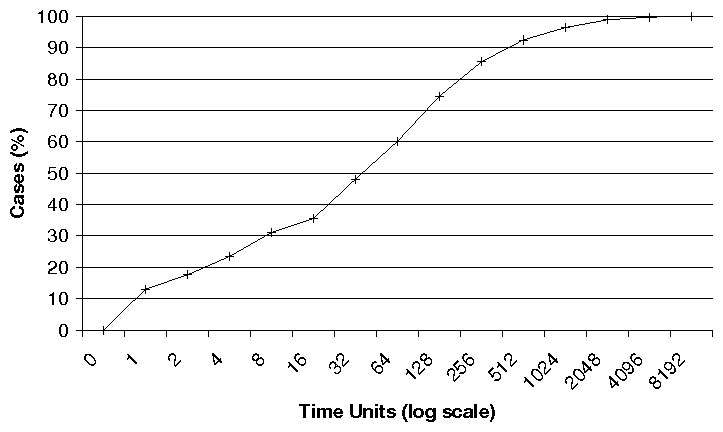
Figure 3: Cumulative Distribution Function (CDF) of resolution time for all customer cases. There is wide variance in problem resolution time, with some cases taking days to solve.

3  Characteristics of Field Problems

3.1  Problem Resolution Time

cause_dist_vantive.png cause_avgtime_vantive.png (a) Categorization of Problem Root Causes        (b) Average Resolution Time per Problem Root Cause Category
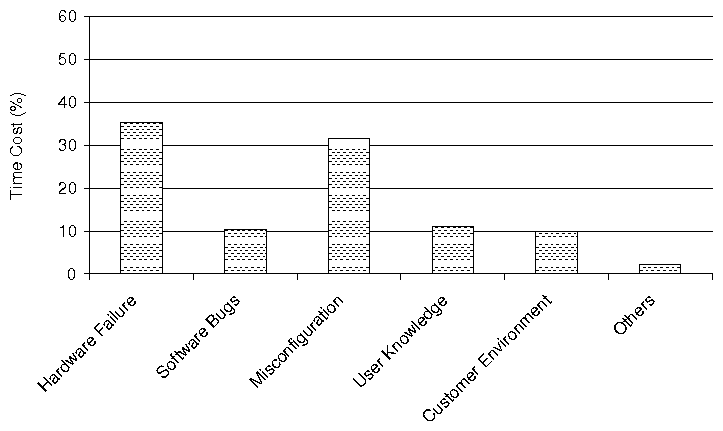
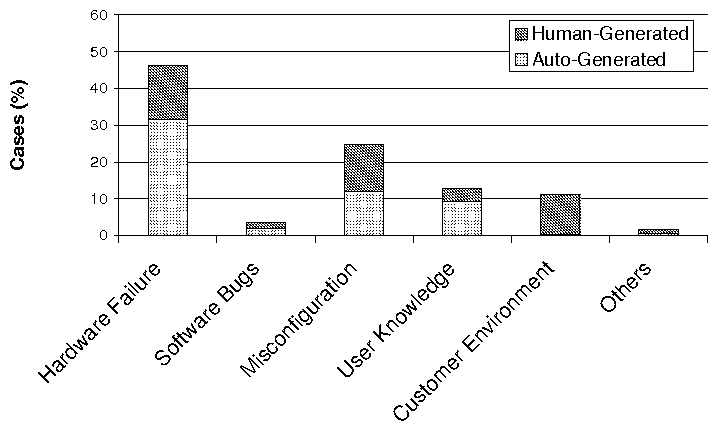
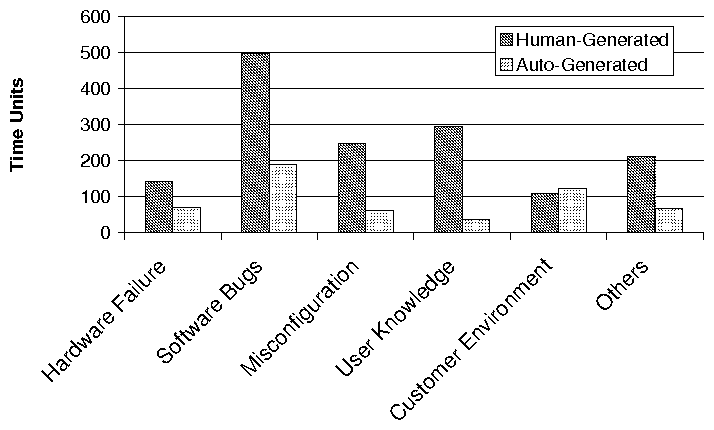
Figure 4: Problem Root Cause Category. Hardware Failure is related to problems with hardware components, such as disk drive. Software Bug is related to storage system software, and Misconfiguration is related to system problems caused by errors in configuration. User Knowledge is related to technical questions, e.g., explaining why customers were seeing certain system behaviors. Customer Environment is related to problems not caused by storage system itself. The figures shows that hardware failures and misconfiguration problems are the major root causes, but software bugs took longer time to resolve.
One of the most important metrics of customer support is problem resolution time, which is time spent between when a case is opened and when the resolution or workaround is available for a customer. The distribution of problem resolution times is the key to understanding the complexity of a specific problem or problem class, since it mostly reflects the amount of time spent on troubleshooting problems. It is important to notice that it should not be directly used to calculate MTTR (Mean Time To Recovery), since it does not capture the amount of time to completely solve the problems (e.g., for hardware related problems, it does not include hardware replacement or when it is scheduled to minimize the impact for users).
Figure 3 shows the Cumulative Distribution Function (CDF) of resolution time for all customer cases selected from the Customer Support Database. It is possible for troubleshooting to take many hours. For a small fraction of cases, resolution time can be even longer. Since the x-axis of the figure is logarithmic, the graph shows that doubling the amount of time spent on problem resolution does not double the number of cases resolved. While the Autosupport logging system is an important step in helping troubleshoot problems, this figure makes the case that better tools and techniques are needed to reduce problem resolution time.
cause_time_vantive.png
Figure 5: Resolution Time Spent on Problem Root Cause by Category. Although software problems take longer time to resolve on average, hardware failure and misconfiguration related problems have greater impact on customer experience.

3.2  Problem Root Cause Categories

Analyzing the distribution of problem root causes is useful in understanding where one should spend effort when troubleshooting customer cases or designing more robust systems. While a problem root cause is precise, such as a SCSI bus failure, in this section we lump root causes into categories such as hardware, software, misconfiguration, etc. For all the customer cases, we study resolution time for each category, relative frequency of cases in each category, and the cost which is the average resolution time multiplied by the number of cases for that category.
As Figure 4 (a) shows, hardware failures and misconfiguration are the two most frequent problem root cause categories, and contribute 40% and 21% to all customer cases, respectively. Software bugs account for a small fraction (3%) of cases. We speculate that software bugs are not that common since software undergoes rigorous tests before being shipped to customers. Besides tests, there are many techniques [12,29,35,36] that can be applied to find bugs in software. While on average, based on figure 4 (b), software bugs take a longer time to resolve, since their number is so small their overall impact on total time spent on all problem resolutions is not very high, as Figure 5 shows.
impact_dist.png impact_avgtime.png (a) Distribution of Problems with Different Impact    (b) Average Resolution Time of Problem with Different Impact
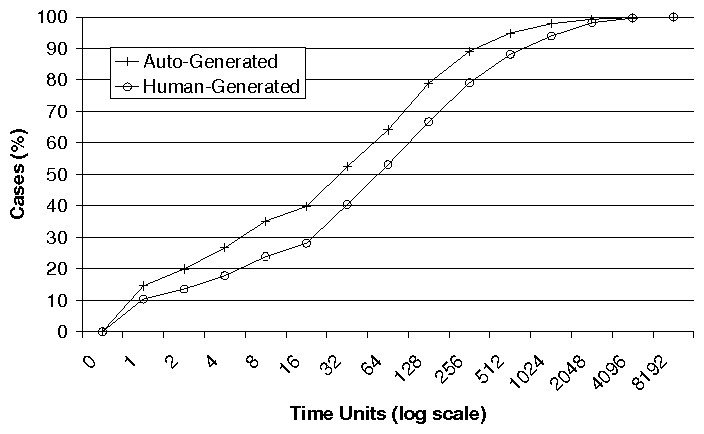
Figure 6: Problem Impact. From the left to the right, it is in the order of higher impact to lower impact on customer experience. Although the problems with higher impact happen much less frequently compared to the problems with lower impacts, they are usually more complicated to resolve.
It is interesting to observe that a relatively significant percentage of customer problems are because customers lack sufficient knowledge about the system (11%) or customers' own execution environments are incorrect (9%) (e.g. a backup failure caused by a Domain Name System error). These problems can potentially be reduced by providing more system training programs or better configuration checkers.
Figure 4 (b) is our first indication that logs are indeed useful in reducing problem resolution time. Auto-generated customer cases i.e. those with an attached system log and problem symptom in the form of a critical event message, take less time to resolve than human-generated cases. The latter are often poorly defined over the phone or by email. The only instance where this is not true is when the problem relates to the customer's environment, which is difficult to record via an automated system.

3.3  Problem Impact

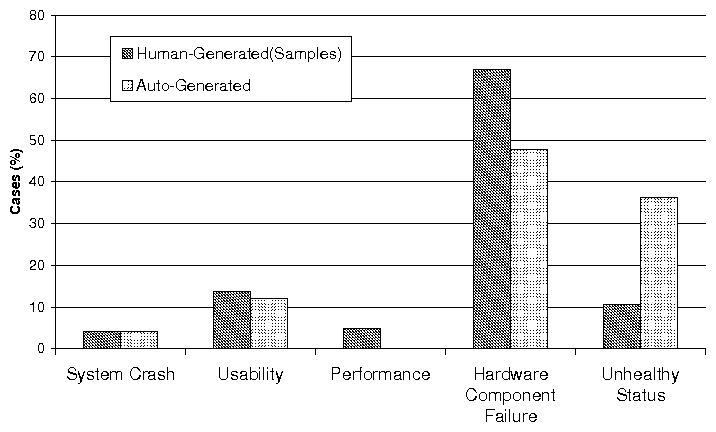
In the previous subsections, we have treated all problems as equal in their impact on customers. We now consider customer impact for each problem category. To do this, we divide customer cases into 6 categories based on impact ranging from system crash which is the most serious, to low impact unhealthy status. The other categories from higher to lower impact are usability (e.g. inability to access a volume), performance, hardware component failure, and unhealthy status (e.g., instability of the interconnects, low spare disk count). Hardware failures typically have low impact since the storage systems are designed to tolerate multiple disk failures [16], power-supply failures, filer head failures etc. However, until the failed component is replaced, the system operates in degraded mode where the potential for complete system failure exists, should its redundant component fail.
Since human-generated customer cases do not have all impact information in structured format, we randomly sampled 200 human-generated cases and manually analyzed them. For auto-generated problems, we include all the cases, and leverage the information in Customer Support Database.
For both human-generated and auto-generated cases, the classification is exclusive: each problem case is classified to one and only one category. The classification is based on how a problem impacts customers' experience. For example, a disk failure that led to a system panic will be classified as an instance of System Crash. If it did not lead to system crash (i.e. RAID handled it) it is classified as an instance of Hardware Component Failure. It is important to notice that, in our study the Performance problems are problem cases that lead to unexpected performance slowdown. Therefore disk failures leading to expected slowdown with RAID reconstruction processes are classified as Hardware Component Failures, instead of Performance problems.
Figure 6 (a) shows the distribution of problems by impact. One obvious observation is that there are far fewer high-impact problems than low-impact ones. More specifically, system crash only contributes about 3%, and usability problems contribute about 10%. Low impact problems such as hardware component failure and unhealthy status contribute about 44% and 20%, respectively.
reporting_time_vantive.png
Figure 7: Case Generation Method and Resolution Time. Auto-Generated problems are resolved faster than Human-Generated problems.
msg_cause_high.png
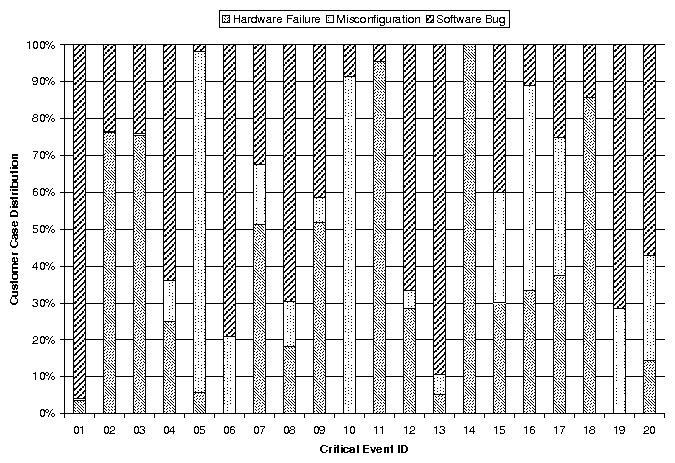
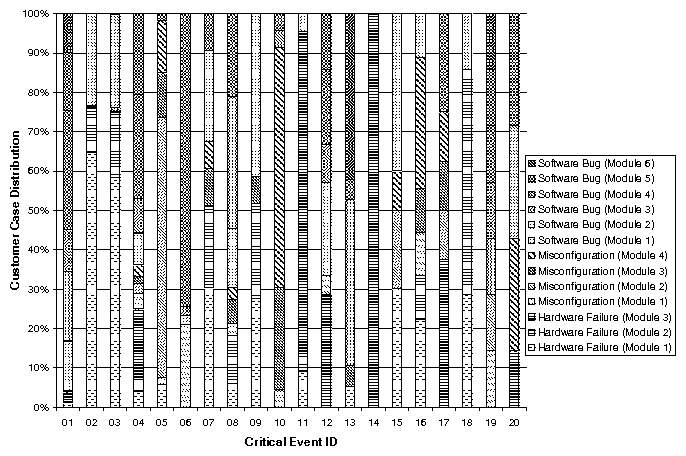
Figure 8: Critical Events can partially help infer high-level problem root causes. The distribution of customer cases across problem root cause categories, for 20 of the most common critical events. 4,769 auto-generated customer cases that contain detailed root cause diagnosis were selected from the Engineering Case Database for this analysis.
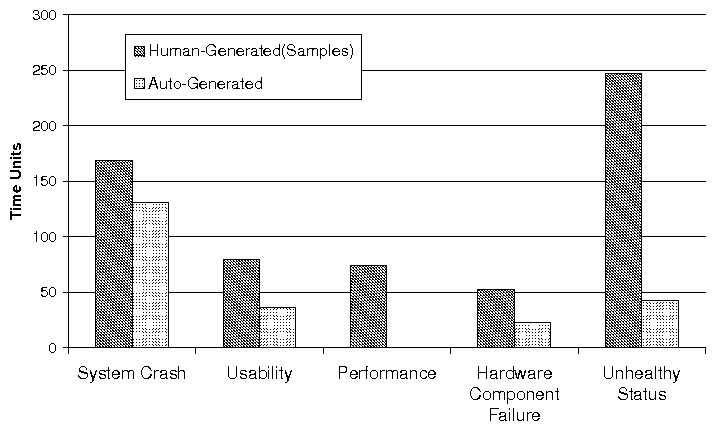
While high-impact problems are much fewer, as Figure 6 (b) shows, they are more time consuming to troubleshoot. This is due to the complex interaction between system modules. For example, the problem shown in Figure 1 resulted in a system crash. The root cause was an error in the SCSI bus bridge. This started a chain of recovery mechanisms in layers of software, including retries by the RAID layer and SCSI layer. As the result, the time from the root cause to system failure is about a half hour, and there are more than 100 log events in between the critical event and problem root cause. This makes manual diagnosis of such problems difficult, even when logs are available.
Finally, as we observed in the previous section, auto-generated cases take less time to resolve than human-generated ones.

3.4  Customer case generation method

As we mentioned in Section 2, 51.6% customer cases were human-generated and 48.4% were auto-generated. We now look at how these two methods impact resolution time.
Figure 7 shows that resolution time for auto-generated and human-generated customer cases is similar in distribution: both show huge variance in time. On the other hand, auto-generated cases were solved faster than human-generated ones.
One possible reason why auto-generated cases can be resolved faster than human-generated ones is that auto-generated cases contain valuable information such as critical events, which capture problem symptoms. In addition, information on prior failures or warnings is available in the system's logs.
In comparison, human-generated problems are usually sent with vague descriptions, which vary from one person to another and this information does not have the same rigorous structure as auto-generated ones.
Similar trends have been observed in Figure 4(b). Across all problem root cause categories, auto-generated cases take 16-88% less resolution time than human-generated cases. The only exception is Customer Environment cases, where auto-generated and human-generated cases take similar average resolution time.
case_raid_volume_failure.png
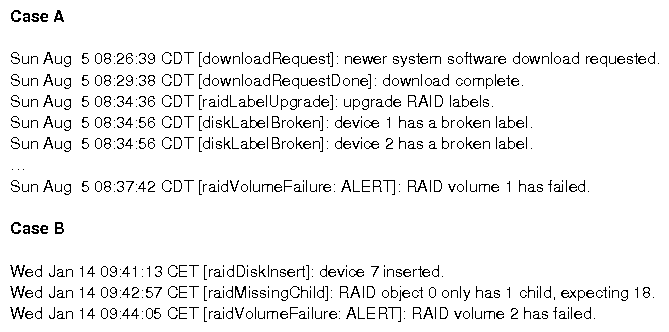
Figure 9: Two real-world customer cases with the same critical event: RAID Volume Failure but different root causes. Case A was caused by a software bug: large-capacity disks, which were previously used in degraded-mode (not used in full capacity), were used in full capacity after a software upgrade. However, due to a software bug, disk labels could not be correctly recognized and multiple broken labels led to a RAID Volume Failure Message. Case B was caused by misconfiguration: customers mistakenly inserted non-zeroed disk into the system, leading to a RAID Volume Failure Message.
msg_cause_detail.png
Figure 10: Critical Events cannot infer module-level problem root causes.
case_disk_failure.png
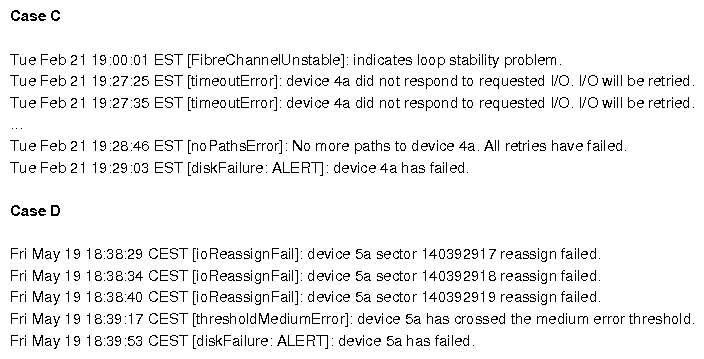
Figure 11: Two real-world customer cases with the Disk Failure Message. Customer case C was caused by Fibre Channel loop instability and customer case D was caused by disk medium errors.

4  Can Critical Events Help Infer Root Causes?

Having established that customer cases with attached system logs result in improved problem resolution time, we now ask if critical events in the logs can be directly used to identify problem root cause. To remind the reader, a critical event is a special kind of log message that contains a problem symptom, and triggers the automatic opening of a customer case via the Autosupport system. An example of such an event is a system panic log message.

4.1  High-level Problem Root Causes

We first look at the relationship between critical events and high-level problem root cause categories: hardware failure, software bug, and misconfiguration. We do not present the results for the other two problem root cause categories (user knowledge and customer environment) because they are often human-generated and rarely have a clear critical event in the system log.
Figure 8 shows the distribution of customer cases amongst the three high-level root cause categories for the 20 most frequent critical events. For this experiment, we selected those auto-generated customer cases from the Customer Support Database that were also in the Engineering Case Database, so that we could relate each customer case to its detailed engineering diagnosis.
As seen in Figure 8, for several critical events, there is a dominant high-level problem root cause. For example, 91% of customer cases with critical event 10 (a Misconfiguration Warning Message) were obviously diagnosed as misconfiguration problems, and 95% of customer cases with critical event 11 (a Hardware Failure Warning Message) were diagnosed as hardware failure problems. This is not surprising, since these critical event messages have clear semantic meaning.
However, some critical events cannot be easily categorized to one dominant high-level problem root cause. One example is critical event 07 (a RAID Volume Failure Message). Among customer cases with critical event 07, 51% cases were diagnosed as hardware failure related, 16% cases were diagnosed as caused by misconfiguration, and 33% cases were diagnosed as caused by software bugs.
To better understand why there is not always a 1-1 mapping between critical event and root cause category, we pick (Figure 9) two real-world auto-generated customer cases, which were both triggered by the same critical event: RAID Volume Failure. As illustrated by the figure, customer case A was caused by a software bug, while customer case B was caused by a misconfiguration (details are explained in the caption).
For a small majority of common critical events (13 out of 20), there is a dominant ( > 65%) high-level problem root cause. Therefore, we conclude that critical events can be used to infer the high-level problem root causes.
However, the high-level root cause isn't enough to resolve the customer's problems. One needs to determine the precise root cause. In the next section, we see if critical events at least help us narrow down the root cause to specific storage system modules.

4.2  Module-level Problem Root Causes

A module-level problem root cause defines which module or component3 caused the problem experienced by the customer. Zooming into one particular module is a significant step towards problem resolution. With such knowledge, customer cases can be effectively assigned to the experts who are familiar with that module.
F-score_bar.png
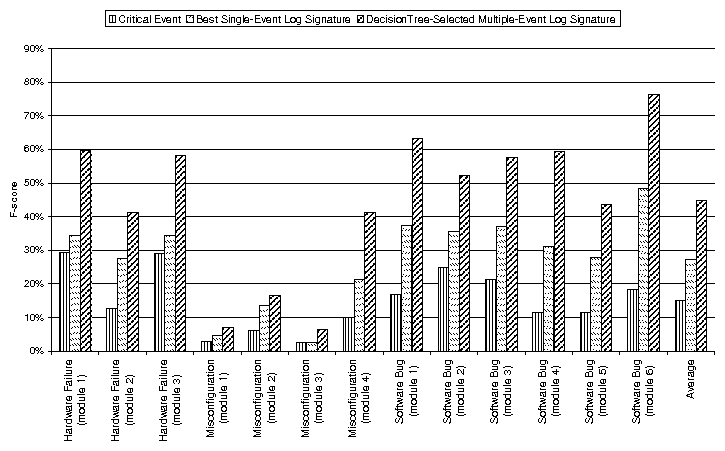
Figure 12: Comparison between three methods of using log events. F-score indicates how accurate a prediction can be made on module-level problem root cause using log information. The same set of customer cases are used here as for Figure 8, except customer cases without AutoSupport logs in AutoSupport Database, ending up with 4,535 customer cases.
Figure 10 presents the distribution of module-level problem root causes among the customer cases with the same critical event. The same data set was used as for Figure 8. The selected customer cases were diagnosed with 13 different module-level root causes. The figure shows that for only 4 out of 20 messages, there is a dominant ( > 65%) module-level problem root cause. Therefore critical events are not indicative of module-level problem root causes.
One explanation is that modules in the storage stack have complex interactions. Multiple code paths can lead to the same failure symptom. An example is critical event 03 (Disk Failure Message), which is quite indicative ( > 75%) of a hardware failure; however, an error in multiple hardware modules can lead to this message. Figure 11 illustrates two real-world customer cases triggered by Disk Failure Messages. As the figure explains, customer case C was actually due to Fibre Channel Loop instability while customer case D was caused by multiple disk medium errors on the same disk.
Since APIs between modules enforce clean separation between caller and callee, modules tend to log "local" state information i.e. what happens within the module. Theoretically a more sophisticated logging infrastructure could store the interactions between modules and generate the critical events that capture "global" system state. However, we believe it is impractical to build such logging infrastructure for existing commercial products, due to the complexity of module interaction. Furthermore, such infrastructure would be very hard to maintain as the system evolves and more modules are added. We believe the solution is to combine the critical log event with other log information and in the next section we study the feasibility of doing so.

5  Feasibility of Using Logs for Automating Troubleshooting

As we analyzed in the previous section, critical events alone are not enough for identifying the problem root cause beyond a high level. This conclusion is supported by several real-world customer cases presented in Figure 9 and Figure 11. These customer cases also suggest that log events in addition to the critical events can be quite useful for identifying the problem root causes.
In this section, we investigate the feasibility of using additional information from system logs and answer the following two questions: Does problem root cause determination improve by considering log events beyond critical events? What kind of log events are key to identifying the problem root cause?
  
Problem # Symptom Cause # of Key Events Distance (secs) Distance (# events) Fuzziness?
1 Battery Low Software Bug 2 5.8 1.6 no
2 Shelf Fault Shelf Intraconnect Defect 3 49.4 3.8 yes
3 System Panic Broken SCSI Bus Bridge 4 509.2 34.4 no
4 Performance Degradation FC Loop Defect 2 3652 69.4 no
5(Figure 1) Power Warning Incorrect Threshold in Code 2 5 2.4 yes
6(Figure 9A)RAID Volume Failure Software Bug 3 196 66.5 no
7(Figure 9B)RAID Volume Failure Non-zeroed Disk Insertion 3 80 35 yes
8 RAID Volume Failure Interconnect Failure 3 290.5 126 yes
9 Shelf Fault Shelf Module Firmware Bug 4 18285.5 21.5 no
10 Shelf Fault Power Supply Failure 3 31.5 3.5 no
Table 1: Characteristics of Log Signatures. We manually studied 35 customer cases. These 35 customer cases can be grouped into 10 groups, where each group had the same problem root cause. Based on diagnosis notes from engineers, we were able to identify the key log events, which can differentiate cases in one group cases in another. "# of Key Log Events" is the total number of important log events (including critical events) needed to identify the problem. "Distance" is calculated as the longest distance from a key log event to a critical event for each customer case, averaged across all cases.

5.1  Are additional log events useful ?

To study whether additional log events are useful, we consider three methods of using log event information, and compare how well they can be used as a module-level problem root cause signature. We define a signature as a set of relevant log events that uniquely identify a problem root cause. Such a signature can be used to identify recurring problems and to distinguish one problem from another unrelated one, thereby helping with customer troubleshooting. It is important to note that we are not designing algorithms to find log signatures, instead we are manually computing log signatures to study how they improve problem root cause determination.
As a baseline, our first method is to only use the problem's critical event as its signature. For each module-level problem root cause, using a set of manually diagnosed cases as training data, we search for one critical event that can best differentiate customer cases diagnosed with this root cause from other customer cases. More specifically, for each module-level problem root cause, we exhaustively search through all critical events, and calculate their F-score, which measures how well the critical event can be used to predict the problem root cause [49]. Then we pick the critical event with the highest F-score as the signature for this module-level problem root cause.
The second method is similar to method one. But instead of just looking at critical events to deduce a root cause signature, we search all log events looking for the one log message that best indicated the module-level root cause. If this method can find log signatures with much better F-score, it indicates that some log events other than critical events provide more valuable information for identifying problem root cause.
The third method is to use a decision tree [9] to find the best mapping between multiple log events and the problem root cause. The resulting multiple log events can be used as the root cause signature.
For all three methods, we use the same set of customer cases as in Figure 8, except removing customer cases without AutoSupport logs. This gives us 4,535 customer cases. A random selection of 60% of these cases is used as training data, while the remaining 40% are used as testing data.
As Figure 12 shows, for all customer cases, using only critical events as the problem signature is a very poor predictor of root cause. On average, it only achieves an F-score of about 0.15. Using the best matched log event, instead of just critical events, can achieve an F-score 0.27. By comparison, the average F-score achieved by the decision tree method for computing problem signatures is 0.45, which is 3x better than using critical events. Based on these results, we conclude that accurate problem root cause determination requires combining multiple log events rather than a single log event or critical event. This observation matters, since customer support personnel usually focus on the critical event, which can be misleading. Furthermore, as we show in the next section, there is often a lot of noise between key log events making it hard to manually detect problem signatures.
Although we use the decision tree to construct log signatures that are composed of multiple log events, we do not advocate this technique as the solution for utilizing log information. First of all, the accuracy(F-score) is still not satisfactory due to log noise, which we discuss later. Moreover, the effectiveness of the decision tree relies on training data. For problem root causes that do not have a large number of diagnosed instances, a decision tree will not provide much help.

5.2  Challenges of using log information

To understand the challenges of using log information and identifying key log events to compute a problem signature, we manually analyzed 35 customer cases sampled from the Engineering Case Database. These customer cases were categorized into 10 groups, such that cases in each group had the same problem root cause.
For these customer cases, we noticed that engineers used several key log events to diagnose the root cause. Table 1 summarizes these cases and characteristics of their key log events.
Based on these 10 groups, we made following major observations:
asup_line_cdf.png
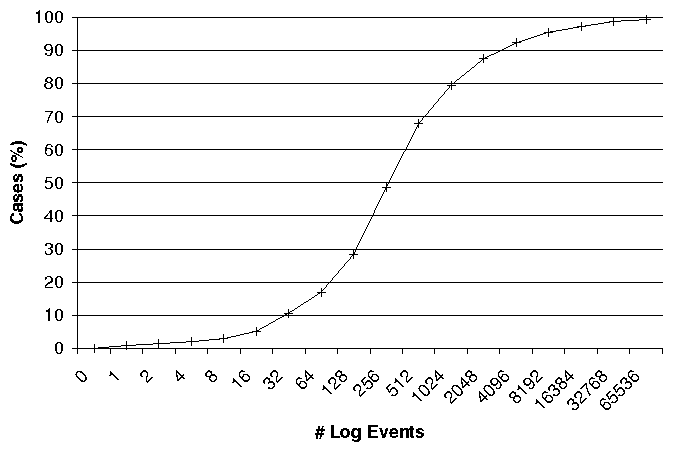
Figure 13: Cumulative Distribution Function (CDF) of number of log events within one hour of critical event. For this figure, we use the same data set as Figure 12. We only count the log events generated and recorded by AutoSupport system within one hour before the critical event, since practically engineers often only exam recent log events for problem diagnosis.
(1) Logs are noisy. 
Figure 13 shows the Cumulative Distribution Function (CDF) of the number of log events in AutoSupport logs corresponding to customer cases. As can be seen in the figure, for majority of the customer cases ( 75%), there are more than 100 log events recorded within an hour before the critical event occurred, and for the top 20% customer cases, more than 1000 log events were recorded.
In comparison, as Table 1 shows, there are usually only 2-4 key log events for a given problem, implying that most log events are just noise for the problem.
(2) Important log events are not easy to locate. 
Table 1 shows the distance between key log events and critical events, both in terms of time and the number of log events. For 6 out of 10 problems, at least one key log event is more than 30 log events away from the critical event, which captures the failure point. For all problems, there are always some irrelevant log events in between the key log events and the critical event. In terms of time, the key log events can be minutes or even hours before the critical event.
(3) The pattern of key log events can be fuzzy. 
Sometimes, it is not necessary to have an exact set of key log events for identifying a particular problem. Using problem 7 as an example, it is not necessary to see "raidDiskInsert" log event, depending on how the system administrator added the disk drive. Another example is problem 2. The same shelf intraconnect error can be detected by different modules, and different log messages can be seen for it depending on which module reports the issue.

5.3  Preliminary Prototype for Automatic Log Analysis

Based on the above observations, we designed and implemented a log analysis prototype to improve the customer troubleshooting process. It is important to note, we are still exploring the design space and evaluating the effectiveness of our log analyzer on real world customer cases.
Our analyzer contains two major functions: extracting log signatures and grouping similar logs sequences. As discussed in observation (1), system logs are very "noisy", containing many log events irrelevant to the problem. We also observed (Table 1) that 2-4 key log events are sufficient to serve as a problem signature.
In order to extract log signatures, our log analyzer automatically ranks log events based on their "importance" As mentioned in observation (2), important log events are difficult to locate and can be far away from critical events (failure points). To solve this challenge, we apply statistical techniques to infer the dependency between the system states represented by log events. Then we design a heuristic algorithm to estimate the "importance" of a log event based on the following two rules:
(1) Between two dependent log events, the temporally precedent event is usually more important than its successor. If two log events are dependent, the earlier one usually captures the system state that is closer to the beginning of the error propagation process.
(2) The larger dependence "fan-out" a log event has, the more important it is. Our reasoning is that if a log event has a dependence relationship with many other log events and it precedes other log events, it signifies a critical system state.
In this manner, we compute "important" log events for a given problem and rank the top four events which we then use as the problem signature. Even if the signature is not entirely accurate, we believe the process of extracting important events and highlighting those can greatly reduce the time spent by customer support staff in manually analyzing logs.
The second function of our log analyzer is to identify similar log sequences As described in observation (3), similar log sequences, that represent the same problem root cause, might not have exactly the same set of key log events. Therefore, our log grouping engine clusters logs based on their similarity, by mapping log signatures into a vector space with each log event as a dimension. We then apply unsupervised classification techniques to group similar sequences together based on their relative positions in the vector space [41].
Since we are still exploring the design space and evaluating the effectiveness of our log analysis techniques, the details of the log analyzer are beyond the scope of this paper and remain as our future work.

6  Related Work

6.1  Problem Characteristic Studies

There have been many prior studies that categorize computer system problems and identify root causes such as we have done.
A number of studies show that operator mistakes are one of the major causes of failures. One of the first studies of fault analysis on commercial fault-tolerant systems [21] analyzes Tandem System outages with more than 2000 systems in scope. Gray classifies causes into 5 major categories and 13 sub-categories, and finds that operator error is the largest single cause of failure in deployed Tandem systems. Murphy and Gent examine causes of system crashes in VAX systems between 1985 and 1993, and find that system management caused more than half of the failures, software about 20%, and hardware about 10% [42]. Similarly, the characteristic study by Oppenheimer et al. classifies Internet service failures into component failures and service failures, and further analyzes root causes for each failure type for each Internet service [45]. They also found that operator error is the largest cause of failures in two of the three services, and configuration errors are the largest category of operator errors. While their work focuses on system outages, we are also interested in failures that don't lead to outages. We classify storage system failures based on symptoms as well as root causes, and further show the correlations between problem root cause, symptom and resolution time.
Ganapathi et al. have developed a categorization framework for Windows registry related problems [20]. Similar to our work, their classification is based on problem manifestation and scope of impact to help understand the problem. Although they have described some causes to problem manifestations, they do not have a clear classification for it. Since our goal is to be able to do problem diagnosis, we study not only the problem symptoms, but also root causes of those symptoms.
Some failure studies are also conducted on storage systems. Jiang et al. conduct a characteristic study of NetApp storage subsystem failures [27,28]. They classify storage subsystem failures into four types, and then study how storage subsystem components can affect storage subsystem reliability.

6.2  Troubleshooting Studies

Since troubleshooting is very time-consuming, quite a few studies have been trying to make it more efficient by automating the process. By studying characteristics of problem tickets in an enterprise IT infrastructure, researchers in IBM T.J. Watson built PDA, a problem diagnosis tool, to help solving problems more efficiently [24]. Banga attempts to automate the diagnosis process of appliance field problems that is usually performed by human experts: system health monitoring and error detection, component sanity checking, and configuration change tracking [6]. Redstone et al. propose a vision of an automated problem diagnosis system by capturing symptoms from users' desktops and matching them against problem database [48].
In order to make this process automated, knowledge about detection and checking rules and logic has to be predefined by human experts. Cohen et al. present a method for extracting signatures from system states to help identify recurrent problems and leverage previous diagnosis efforts [15]. Alternatively, by comparing the target configuration file with the mass of healthy configuration files [55], Wang et al. identified problematic configuration entries that cause Windows system problems. Similarly, Wang [56] and Lao [34] address misconfiguration problems in Windows systems by building and identifying signatures of normal and abnormal Windows Registry entries. Some studies apply some advanced techniques such as data mining to troubleshooting. For example, PinPoint [14,13] traces and collects requests, and performs data clustering analysis on them to determine the combinations of components that are likely to be the cause of failures.
It is important to collect system traces for troubleshooting like AutoSupport logging systems. Magpie [7], Flight Data Recorder [54], and the work by Yuan et al. [58] improve system management by using fine-grained system event-tracing mechanisms and analysis. Stack back traces are used by several diagnostic systems, including Dr. Watson [18], Gnome's bug-buddy [11], and IBM diagnosis tool [40].

6.3  Log Analysis

There are two major directions taken by previous researchers to analyze system logs: tupling and dependency extraction.
As a system failure may propagate through multiple system components, multiple log events indicating failure or abnormal status of components can be generated during a short period of time. Based on this observation, several studies try to reduce the complexity of system logs by grouping successive log events into tuples [8,10,23,26,37,38,53]. For example, Tsao [53], Hansen [23] and Lin [38] applied variants of tupling algorithms on system logs collected from VAX/VMS machines. The tupling algorithms explore the time-space relationship between log events, and cluster temporally related events into tuples, so that the number of logical entities can be significantly reduced. The limitation of tupling algorithms is that log events in a tuple may be unrelated if related log events are interleaving with irrelevant log events. Unfortunately, based on our study on modern system logs, such a limitation is fatal.
Another direction taken by previous studies is to extract dependency between log events. Steinle et al. [50] apply two data mining techniques, aiming at finding the dependency between two events in a log collected from Geneva university hospitals environment. The first technique estimates the distribution of temporal distance between two events, and compares against random distribution. The second technique extracts the correlation between two event types using association statistics. Aguilera et al. [2] apply signal processing techniques to extract dependency between events. The main hypothesis behind this work is that if two events are correlated, one or a few typical temporal gaps between these two events can be found through signal processing. Our study is focused on characteristic study on manually identified key log events, and discusses the challenges and opportunities for applying log analysis. Several observations made in our study using storage system logs are consistent with conclusions made in  [31]. Both studies identified that the noisy and redundant log information make log analysis a challenging task and there is great value to extract event correlations for capturing error context and propagation. However, comparing to  [31], which made a qualitative study using 2-week distributed system logs, our study looked at 4,769 storage system log files with the corresponding real-world problem diagnosis, carried out a quantitative study on the usefulness of logs, and proposed an automatic log analysis solution.

7  Conclusion

In this paper, we present one of the first studies of the characteristics of customer problem troubleshooting from logs, using a large set of customer support cases from NetApp. Our results show that customer problem troubleshooting is a very time consuming and challenging task, and can benefit from automation to speedup resolution time. We observed that customer problems with attached logs were invariably resolved sooner than those without logs. We show that while a single log event, or critical log event is a poor predictor of problem root cause, combining multiple key log events leads to a 3x improvement in root cause determination. Our results also show that logs are challenging to analyze manually because they are noisy and that key log events are often separated by hundreds of unrelated log messages. We then outlined our ideas for an automatic log analysis tool that can speed up problem resolution time.
Similar to other characteristic studies, it is impossible to study a handful of different data sets, especially for customer support problems due to the unavailability of such data sets. Even though our data set (which is already very large with 636,108 cases from 100,000 systems) is limited only to NetApp, we believe that this study is an important first-step in quantifying both the usefulness of and challenge in using logs for customer problem troubleshooting. We hope that our study can inspire and motivate characteristic studies about other kinds of systems as well, and motivate the creation of new tools for automated log analysis for customer problem troubleshooting.
0.8

References

[1]
C. Abad, J. Taylor, C. Sengul, W. Yurcik, Y. Zhou, and K. Rowe. Log correlation for intrusion detection: A proof of concept. In ACSAC '03: Proceedings of the 19th Annual Computer Security Applications Conference, page 255, Washington, DC, USA, 2003. IEEE Computer Society.
[2]
M. K. Aguilera, J. C. Mogul, J. L. Wiener, P. Reynolds, and A. Muthitacharoen. Performance debugging for distributed systems of black boxes. In Proceedings of SOSP, Bolton Landing, NY, Oct. 2003.
[3]
P. Bahl, R. Chandra, A. Greenberg, S. Kandula, D. A. Maltz, and M. Zhang. Towards highly reliable enterprise network services via inference of multi-level dependencies. In SIGCOMM '07: Proceedings of the 2007 conference on Applications, technologies, architectures, and protocols for computer communications, pages 13-24, New York, NY, USA, 2007. ACM.
[4]
L. N. Bairavasundaram, G. R. Goodson, S. Pasupathy, and J. Schindler. An analysis of latent sector errors in disk drives. SIGMETRICS Perform. Eval. Rev., 35(1):289-300, 2007.
[5]
L. N. Bairavasundaram, G. R. Goodson, B. Schroeder, A. C. Arpaci-Dusseau, and R. H. Arpaci-Dusseau. An Analysis of Data Corruption in the Storage Stack. In FAST '08: Proceedings of the 6th USENIX Conference on File and Storage Technologies, San Jose, CA, Feb. 2008.
[6]
G. Banga. Auto-diagnosis of field problems in an appliance operating system. In ATEC '00: Proceedings of the annual conference on USENIX Annual Technical Conference, pages 24-24, Berkeley, CA, USA, 2000. USENIX Association.
[7]
P. Barham, A. Donnelly, R. Isaacs, and R. Mortier. Using magpie for request extraction and workload modelling. In OSDI'04: Proceedings of the 6th conference on Symposium on Opearting Systems Design & Implementation, pages 18-18, Berkeley, CA, USA, 2004. USENIX Association.
[8]
A. Bondavalli, S. Chiaradonna, F. D. Giandomenico, and F. Grandoni. Threshold-based mechanisms to discriminate transient from intermittent faults. IEEE Transactions on Computers, 49(3):230-245, 2000.
[9]
L. Breiman, J. H. Friedman, R. A. Olshen, and C. J. Stone. Classification and Regression Trees. Statistics/Probability Series. Wadsworth Publishing Company, Belmont, California, U.S.A., 1984.
[10]
M. F. Buckley and D. P. Siewiorek. A comparative analysis of event tupling schemes. In FTCS '96: Proceedings of the The Twenty-Sixth Annual International Symposium on Fault-Tolerant Computing (FTCS '96), page 294, Washington, DC, USA, 1996. IEEE Computer Society.
[11]
Bug-buddy GNOME bug-reporting utility, 2004. https://directory.fsf.org/All_Packages_in_Directory/bugbuddy.html.
[12]
B. Chelf and A. Chou. The next generation of static analysis: Boolean satisfiability and path simulation - a perfect match. In Coverity White Paper, 2007.
[13]
M. Y. Chen, A. Accardi, E. Kiciman, J. Lloyd, D. Patterson, A. Fox, and E. Brewer. Path-based faliure and evolution management. In NSDI'04: Proceedings of the 1st conference on Symposium on Networked Systems Design and Implementation, pages 23-23, Berkeley, CA, USA, 2004. USENIX Association.
[14]
M. Y. Chen, E. Kiciman, E. Fratkin, A. Fox, and E. Brewer. Pinpoint: Problem determination in large, dynamic internet services. In DSN '02: Proceedings of the 2002 International Conference on Dependable Systems and Networks, pages 595-604, Washington, DC, USA, 2002. IEEE Computer Society.
[15]
I. Cohen, S. Zhang, M. Goldszmidt, J. Symons, T. Kelly, and A. Fox. Capturing, indexing, clustering, and retrieving system history. In SOSP '05: Proceedings of the twentieth ACM symposium on Operating systems principles, pages 105-118, New York, NY, USA, 2005. ACM.
[16]
P. Corbett, B. English, A. Goel, T. Grcanac, S. Kleiman, J. Leong, and S. Sankar. Row-diagonal parity for double disk failure correction. In FAST '04: Proceedings of the 3rd USENIX Conference on File and Storage Technologies, pages 1-14, 2004.
[17]
Crimson Consulting Group. The solaris 10 advantage: Understanding the real cost of ownership of red hat enterprise linux. In Crimson Consulting Group Business White Paper, 2007.
[18]
Microsoft Corporation. Dr. Watson Overview, 2002. https://www.microsoft.com/TechNet/prodtechnol/winxppro/proddocs/drwatson_overview.asp.
[19]
R. Finlayson and D. Cheriton. Log files: an extended file service exploiting write-once storage. In SOSP '87: Proceedings of the eleventh ACM Symposium on Operating systems principles, pages 139-148, New York, NY, USA, 1987. ACM.
[20]
A. Ganapathi, Y.-M. Wang, N. Lao, and J.-R. Wen. Why pcs are fragile and what we can do about it: A study of windows registry problems. In DSN '04: Proceedings of the 2004 International Conference on Dependable Systems and Networks, page 561, Washington, DC, USA, 2004. IEEE Computer Society.
[21]
J. Gray. Why do computers stop and what can be done about it? In Symposium on Reliability in Distributed Software and Database Systems, 1986.
[22]
S. Hallem, B. Chelf, Y. Xie, and D. Engler. A system and language for building system-specific, static analyses. In PLDI '02: Proceedings of the ACM SIGPLAN 2002 Conference on Programming language design and implementation, pages 69-82, New York, NY, USA, 2002. ACM.
[23]
J. P. Hansen. Trend analysis and modeling of uni/multi-processor event logs. In Master Thesis, Dept. Electrical and Computer Engineering, Carnegie Mellon University, 1998.
[24]
H. Huang, I. Raymond Jennings, Y. Ruan, R. Sahoo, S. Sahu, and A. Shaikh. PDA: a tool for automated problem determination. In LISA'07: Proceedings of the 21st conference on 21st Large Installation System Administration Conference, pages 1-14, Berkeley, CA, USA, 2007. USENIX Association.
[25]
S. Inc. Why splunk? In Splunk White Paper, 2006.
[26]
R. K. Iyer, L. T. Young, and P. V. K. Iyer. Automatic recognition of intermittent failures: An experimental study of field data. IEEE Trans. Comput., 39(4):525-537, 1990.
[27]
W. Jiang, C. Hu, Y. Zhou, and A. Kanevsky. Are disks the dominant contributor for storage failures? a comprehensive study of storage subsystem failure characteristics. In FAST '08: Proceedings of the 5th conference on USENIX Conference on File and Storage Technologies, 2008.
[28]
W. Jiang, C. Hu, Y. Zhou, and A. Kanevsky. Don't blame disks for every storage subsystem failure. In NetApp Technical Journal, 2008.
[29]
S. Johnson. Lint, a c program checker, 1978.
[30]
S. Kandula, D. Katabi, and J.-P. Vasseur. Shrink: a tool for failure diagnosis in ip networks. In MineNet '05: Proceedings of the 2005 ACM SIGCOMM workshop on Mining network data, pages 173-178, New York, NY, USA, 2005. ACM.
[31]
M. P. Kasick, P. Narasimhan, K. Atkinson, and J. Lepreau. Towards fingerpointing in the emulab dynamic distributed system. In WORLDS'06: Proceedings of the 3rd conference on USENIX Workshop on Real, Large Distributed Systems, pages 7-7, Berkeley, CA, USA, 2006. USENIX Association.
[32]
R. R. Kompella, J. Yates, A. Greenberg, and A. C. Snoeren. Ip fault localization via risk modeling. In NSDI'05: Proceedings of the 2nd conference on Symposium on Networked Systems Design & Implementation, pages 57-70, Berkeley, CA, USA, 2005. USENIX Association.
[33]
L. Lancaster and A. Rowe. Measuring real-world data availability. In LISA '01: Proceedings of the 15th USENIX conference on System administration, pages 93-100, Berkeley, CA, USA, 2001. USENIX Association.
[34]
N. Lao, J.-R. Wen, W.-Y. Ma, and Y.-M. Wang. Combining high level symptom descriptions and low level state information for configuration fault diagnosis. In LISA '04: Proceedings of the 18th USENIX conference on System administration, pages 151-158, Berkeley, CA, USA, 2004. USENIX Association.
[35]
Z. Li, S. Lu, S. Myagmar, and Y. Zhou. Cp-miner: a tool for finding copy-paste and related bugs in operating system code. In OSDI'04: Proceedings of the 6th conference on Symposium on Opearting Systems Design & Implementation, pages 20-20, Berkeley, CA, USA, 2004. USENIX Association.
[36]
Z. Li and Y. Zhou. Pr-miner: automatically extracting implicit programming rules and detecting violations in large software code. In ESEC/FSE-13: Proceedings of the 10th European software engineering conference held jointly with 13th ACM SIGSOFT international symposium on Foundations of software engineering, pages 306-315, New York, NY, USA, 2005. ACM.
[37]
Y. Liang, Y. Zhang, H. Xiong, and R. K. Sahoo. An adaptive semantic filter for blue gene/l failure log analysis. In IPDPS, pages 1-8, 2007.
[38]
T. T. Y. Lin and D. P. Siewiorek. Error log analysis: statistical modeling and heuristic trend analysis. Reliability, IEEE Transactions on, 39(4):419-432, 1990.
[39]
I. LogLogic. Logs: Data warehouse style. In LogLogic White Paper, 2007.
[40]
G. Lohman, J. Champlin, and P. Sohn. Quickly finding known software problems via automated symptom matching. In ICAC '05: Proceedings of the Second International Conference on Automatic Computing, pages 101-110, Washington, DC, USA, 2005. IEEE Computer Society.
[41]
T. Mitchell. Machine learning. McGraw Hill, 1997.
[42]
B. Murphy and T. Gent. Measuring system and software reliability using an automated data collection process. Quality and Reliability Engineering International, 11, 1995.
[43]
K. Nagaraja, F. Oliveira, R. Bianchini, R. P. Martin, and T. D. Nguyen. Understanding and dealing with operator mistakes in internet services. In OSDI'04: Proceedings of the 6th conference on Symposium on Opearting Systems Design & Implementation, pages 5-5, Berkeley, CA, USA, 2004. USENIX Association.
[44]
I. Network Appliance. Proactive health management with autosupport. In NetApp White Paper, 2007.
[45]
D. Oppenheimer, A. Ganapathi, and D. A. Patterson. Why do internet services fail, and what can be done about it? In USITS'03: Proceedings of the 4th conference on USENIX Symposium on Internet Technologies and Systems, pages 1-1, Berkeley, CA, USA, 2003. USENIX Association.
[46]
D. Patterson, A. Brown, P. Broadwell, G. Candea, M. Chen, J. Cutler, P. Enriquez, A. Fox, E. Kiciman, M. Merzbacher, D. Oppenheimer, N. Sastry, W. Tetzlaff, J. Traupman, and N. Treuhaft. Recovery oriented computing (roc): Motivation, definition, techniques,. Technical report, Berkeley, CA, USA, 2002.
[47]
E. Pinheiro, W.-D. Weber, and L. A. Barroso. Failure trends in a large disk drive population. In FAST '07: Proceedings of the 5th USENIX conference on File and Storage Technologies, pages 2-2, Berkeley, CA, USA, 2007. USENIX Association.
[48]
J. A. Redstone, M. M. Swift, and B. N. Bershad. Using computers to diagnose computer problems. In HOTOS'03: Proceedings of the 9th conference on Hot Topics in Operating Systems, pages 16-16, Berkeley, CA, USA, 2003. USENIX Association.
[49]
C. J. V. Rijsbergen. Information Retrieval. Butterworth-Heinemann, Newton, MA, USA, 1979.
[50]
M. Steinle, K. Aberer, S. Girdzijauskas, and C. Lovis. Mapping moving landscapes by mining mountains of logs: novel techniques for dependency model generation. In VLDB '06: Proceedings of the 32nd international conference on Very large data bases, pages 1093-1102. VLDB Endowment, 2006.
[51]
Linux system logging utilities. Linux Man Page: SYSKLOGD(8).
[52]
The Association of Support Professionals. Technical Support Cost Ratios. 2000.
[53]
M. M. Tsao. Trend analysis and fault prediction. In PhD Dissertation, Dept. Electrical and Computer Engineering, Carnegie Mellon University, 1998.
[54]
C. Verbowski, E. Kiciman, A. Kumar, B. Daniels, S. Lu, J. Lee, Y.-M. Wang, and R. Roussev. Flight data recorder: monitoring persistent-state interactions to improve systems management. In OSDI '06: Proceedings of the 7th symposium on Operating systems design and implementation, pages 117-130, Berkeley, CA, USA, 2006. USENIX Association.
[55]
H. J. Wang, J. C. Platt, Y. Chen, R. Zhang, and Y.-M. Wang. Automatic misconfiguration troubleshooting with peerpressure. In OSDI'04: Proceedings of the 6th conference on Symposium on Opearting Systems Design & Implementation, pages 17-17, Berkeley, CA, USA, 2004. USENIX Association.
[56]
Y.-M. Wang, C. Verbowski, J. Dunagan, Y. Chen, H. J. Wang, C. Yuan, and Z. Zhang. Strider: A black-box, state-based approach to change and configuration management and support. In LISA '03: Proceedings of the 17th USENIX conference on System administration, pages 159-172, Berkeley, CA, USA, 2003. USENIX Association.
[57]
A. C. Xansa, A. Hanna, C. Rudd, I. Macfarlane, J. Windebank, and S. Rance. An Introductory Overview of ITIL v3. https://www.itsmfi.org/, 2007.
[58]
C. Yuan, N. Lao, J.-R. Wen, J. Li, Z. Zhang, Y.-M. Wang, and W.-Y. Ma. Automated known problem diagnosis with event traces. SIGOPS Oper. Syst. Rev., 40(4):375-388, 2006.
Trademark Notice: 2009 NetApp. All rights reserved. Specifications are subject to change without notice. NetApp, the NetApp logo, Go further, faster, and RAIS-DP are trademarks or registered trademark of NetApp, Inc. in the United States and/or other countries. Windows is a registered trademarks of Microsoft Corporation. Linux is a registered trademark of Linus Torvalds.
3We will use module to represent both software module and hardware component in the rest of the paper