FAST '05 Paper
[FAST '05 Technical Program]


TBBT: Scalable and Accurate Trace Replay
for File Server Evaluation
Ningning Zhu, Jiawu Chen and Tzi-Cker Chiueh
Stony Brook University, Stony Brook, NY 11790
{nzhu, jiawu, chiueh}@cs.sunysb.edu
Abstract:
This paper describes the design, implementation, and
evaluation of TBBT, the first comprehensive NFS trace replay tool.
Given an NFS trace, TBBT automatically detects and repairs missing
operations in the trace, derives a file system image required to
successfully replay the trace, ages the file system image appropriately,
initializes the file server under test
with that image,
and finally drives the file server with a workload
that is derived from replaying the trace
according to user-specified parameters. TBBT can scale a trace
temporally or spatially to meet the need of a simulation run
without violating
dependencies among file system operations in the trace.
1 Introduction
Modern file systems are typically optimized to take advantage of
specific workloads.
Therefore the performance of a file system
must be evaluated with respect to its target workload.
The ideal benchmarking workload should be
representative of the way that actual applications will use the file system,
effective in predicting the system's
performance in the target environment, scalable
so as to simulate the system under different loads,
easy to generate, and reproducible.
At present, the most common workloads for file system evaluation are
synthetic benchmarks. These benchmarks are designed to recreate the
characteristics of particular environments.
Although in recent years synthetic
benchmarks have improved significantly in terms of realism and the
degree with which they can be tailored to a specific application, it
is not always possible for a synthetic benchmark to mimic file access
traces collected from a real-world environment because there may be
many time-varying and site-specific factors that are difficult, if not
impossible, for a synthetic benchmark to capture. For example,
recent file access trace analyses show that modern file servers
are experiencing a variety of workloads with
widely divergent characteristics
[7,18,22].
Because the time required to develop a high-quality benchmark is often
on the order of months or years, benchmarks cannot keep up with the
changes in the workload of specific target environments.
In contrast to synthetic
benchmarks, traces taken from the system being evaluated are, by
definition, representative of that system's workload.
Trace replay can serve as a basis for file system
workload generation and thereby performance evaluation. Although file
system traces are often used as the basis for workload
characterization and development of many file system design
techniques, they are rarely used in the evaluation of file systems or
servers. Given that disk, network, and web access traces have been
used extensively to evaluate storage systems, network protocols, and
web servers respectively, we see no reason why file access traces
should not be a complementary method to evaluate file systems.
Replaying an NFS trace against a live file system/server is non-trivial
for the following reasons. First, because a file system is stateful,
a trace replay tool must ensure that the correct context for each
request exists in the file system under test before it is
replayed. For example, a file open request can be successfully
replayed only if the associated file already exists.
Second, the effect of aging on a file system may have a
significant impact on its performance, and realistically
and efficiently aging a file system is a difficult problem
[20].
Finally, because a trace could be collected on a file system
whose performance is very different from that of the target file system,
it is essential that a trace replay tool be able to scale up or down the
dispatch rate of trace requests to meet specific benchmarking requirements,
without violating any inter-request dependencies.
In this paper we present the design, implementation, and evaluation of
a novel NFS trace player named TBBT (Trace-Based file system
Benchmarking Tool) and describe how it addresses each of these three
issues. TBBT can infer from a trace the directory hierarchy of the file
system underlying the trace, construct a file system image with the same
hierarchy, replay the trace at a user-specified rate and gather performance
measurements. Because traces do not carry physical layout information,
it is impossible for TBBT to incorporate the actual aging effects in the
construction of the initial file system image.
However, TBBT does support an artificial aging
method that allows users to incorporate a particular
degree of file aging into the initial file system image
used in their simulation.
TBBT also allows its users to scale up the
trace to simulate additional clients and/or higher-speed clients
without violating the dependencies
among file access requests in the trace. Finally, TBBT is robust in the face of
tracing errors in that it can automatically detect and repair inconsistencies
in incompletely collected traces.
TBBT is designed to overcome certain limitations of synthetic benchmarks,
but it also has its own limitations, as described in Section 6.
It is not meant to replace synthetic benchmarks but to complement them.
2 Related Work
Ousterhout's file system trace analysis [17] and
the Sprite trace analysis [3] motivated many
research efforts in log-structured file systems, journaling,
and distributed file systems.
More recent trace studies have demonstrated that file system workloads
are diverse and vary widely depending on the applications they serve,
and that workloads have changed over time, and raise new issues for
researchers to address: Roselli et al. measured a range of workloads
and showed that file sizes have become larger and large files are often
accessed randomly, in contrast to findings from earlier studies
[18]. Vogels showed that workloads on
personal computers differ from most previously studied workloads
[22]. More recently, Ellard and Mesnier et al. demonstrated
that there is a strong relationship between the names and other
create-time attributes and the lifespan, size and access patterns of
files [7,16].
Gibson et al. used a trace replay approach to evaluate two networked
storage architectures: Networked SCSI disks and NASD [10].
Two traces were used: one is a week-long NFS trace from
Berkeley [6] and the other is a month-long AFS
trace from CMU. The traces were decomposed
into client-minutes, each of which represents one minute of
activity from a client. Specific client-minutes are selected,
mixed and scaled to represent different workloads. Their paper did
not mention how they perform file system initialization or handle
dependency issues. Rather than implementing a full-fledged and
accurate trace replay mechanism, their trace play tool is limited to
the functionality required for their research.
There are two types of synthetic benchmarks. The first type generates
a workload by using real applications. The examples
include the Andrew Benchmark
[11], SSH-Build [19], and SDET
[9]. The advantage of such benchmarks is that they capture
the application dependencies between file system operations as well as
application think-time. The disadvantage is that they are usually
small and do not represent the workload of a large, general
purpose networked file server.
The second type of synthetic benchmarks directly generate a workload
through the system call interface or network file system protocol.
Examples of such benchmarks include SPECsfs [21] and
Postmark [12]. These benchmarks are easy to scale
and fairly general-purpose, but it is difficult for such benchmarks to
simulate a diverse and changing workload or the application-level
operation dependencies and think-time. Recent research on file system
benchmarking focuses on building flexible synthetic benchmarks to give
user control over the workload patterns or building more complex
models to emulate dependencies among file system operations (hBench
[5], Fstress [1], FileBench
[13]). In this paper, the main comparison of our work is
with SPECsfs, a widely-used general-purpose benchmark for NFS servers
[21]. Both SPECsfs and TBBT bypass the NFS client and
access the server directly. SPECsfs attempts to recreate a typical
workload based on characterization of real traces. Unfortunately, the
result does not resemble any NFS workload we have observed.
Furthermore, we question whether a typical workload actually exists -
each NFS trace we have examined has unique characteristics.
Smith developed an artificial aging technique to create an aged file
system image by running a workload designed to simulate the aging
process [20]. This workload is created from file
system snapshots and traces. After aging stage, there would be workload
for benchmark run. The aging workload and the benchmark run
workload have disjoint data sets. Yet since they share the
same file system space, the free space fragmented by the aging workload would
affects the benchmark run.
This technique can be used for benchmarks that have a
relatively small data set and do not have a dedicated initialization
phase. Usually these benchmarks are micro-benchmarks or small
macro-benchmarks such as SSH-Build. This technique is not applicable
for benchmarks that take full control of a logical partition and has
its own initialization procedure, such as SPECsfs. Smith's aging
technique requires writing 80 GB of data (which requires several hours
of run time) to age a 1 GB file system for the equivalent of seven
months. This makes it impractical to use this method to age large
file systems. TBBT ages the benchmark run load directly.
TBBT's aging technique is less realistic,
but runs two orders of magnitude more quickly.
Buttress is an disk I/O generation tool specifically designed to issue
requests with accurate timing [2]. In benchmarking disk
I/O systems, it is important to generate the I/O accesses that meet
exactly the timing requirement. However, timing accuracy (issuing
I/Os at the desired time) at high I/O rate is difficult to achieve on
stock operating systems. TBBT suffers the same problem when the timestamp-based timing policy (as described in Section
3.4.1) is used to generate file
system requests. Buttress can generate I/O workloads with microsecond
accuracy at the I/O throughput of high-end enterprise storage arrays.
Buttress's timing control technique is flexible and portable, and
provides a simple interface for load generation. TBBT could
incorporate Buttress's technique to improve the timing accuracy of its
request dispatching.
There are other disk-level benchmarks such as IObench [23]
and lmbench [15]. All
disk-level benchmarks do not need to address the complicated issue of
dependencies among file system operations.
3 Design Issues
3.1 Trace Transformation
Table 1:
Fields of a TBBT trace record.
| Field |
Description |
| callTime |
Timestamp of the request |
| replyTime |
Timestamp of the reply |
| opType |
NFS operation type |
| opParams |
Request parameters
(specific to the opType) |
| opReturn |
Values returned by the operation |
|
TBBT uses a trace format that consists of a pair of request
and reply -  callTime, replyTime, opType, opParams,
opReturn callTime, replyTime, opType, opParams,
opReturn , as described in Table 1. The
request and reply are paired up through their RPC message exchange ID. The opType is equivalent to the NFS procedure number in the original
trace. The opParams and opReturn are similar to the
corresponding NFS procedure parameters and return values.
TBBT currently handles NFSv2 and NFSv3. , as described in Table 1. The
request and reply are paired up through their RPC message exchange ID. The opType is equivalent to the NFS procedure number in the original
trace. The opParams and opReturn are similar to the
corresponding NFS procedure parameters and return values.
TBBT currently handles NFSv2 and NFSv3.
One important aspect of the TBBT trace format is creating the
TBBT trace is more than a matter of simply reformatting the original
trace. One example of this is the way that TBBT rewrites each NFS
filehandle. In the NFS protocol, a filehandle is used to
identify a specific file or directory. The problem is that it is
possible for a single object to have more than one filehandle
(because many implementations embed information such as the object
version number and file system mount point inside the filehandle). To make matters worse, some NFS operations (such as create, lookup, and remove) use a name to identify a file
instead of using a filehandle. For example, in the case of create or mkdir, the filehandle is not known to the
client because the file or directory does not yet exist. To avoid any
potential for ambiguity, TBBT assigns TBBT-IDs to all of the
files and directories that appear in the trace. TBBT extracts the full
pathname of all files and directories through our file system hierarchy
extraction algorithm and stores the information in a hierarchy map, as described in Section 3.2. The NFS server might
use a different filehandle for a particular file every time the
trace is replayed, but the TBBT-ID will never change.
TBBT also inserts additional information into the trace records to
facilitate trace replay. For example, neither a remove request
nor a remove reply contains the filehandle of the removed
file, which is needed for file system dependency analysis during trace
replay (as discussed in Section 3.4.1). The same
problem exists for rmdir and rename. For all three
operations, TBBT infers the TBBT-ID of the object in question from
the parent's TBBT-ID, the object name and the file system image, and
inserts it into the associated trace record.
Another aspect of TBBT trace rewriting is dealing with errors or
omissions in the original trace. The most common error is packet
loss. The traces we use for our experiments are reportedly missing as
many as 10% of the NFS calls and responses during periods of bursty
traffic [7]. The number of lost calls and
responses can be estimated by analyzing the progression of RPC
exchange IDs (XIDs), which are typically generated by using a simple
counter, but this does nothing to tell us what was lost.
In many cases, the contents of missing calls may be inferred -
although not always with complete certainty. For example, if we
observe the request sequence remove A; remove A and each of
these requests has a successful reply, then it is clear that there
must be a create, rename, symlink, or link
request between the two remove requests - some time between
when the file ``A'' is removed the first and second times, another file
named ``A'' must have appeared - but this event is missing from the
trace. If we simply replayed the trace without correcting this
problem, then then second remove A would fail instead of
succeed. Such a discrepancy is called a replay failure. The
correction is to insert some NFS operations to replace the missed
packets. Note that it is also a replay failure if the replay of an
operation returns success while the original trace recorded failure,
or both return failure but with different failures.
We use a table-driven heuristic approach to select corrective operations and
insert them into the replay stream. To enumerate all possible
combinations of operations, trace return codes, and replay return
codes could require an enormous table - but in practice, the
combinations we have actually encountered all fall into approximately
thirty distinct cases. Table 2 illustrates a small
number of unexpected replay failures and our resolution rules.
Table 2:
Examples of trace corrections. In these examples, the operation
was observed to succeed in the trace, but would fail during replay.
To prevent the failure, corrective operations are are added to replay
to ensure that the observed operation will succeed.
| Op |
Replay error |
Corrective Op(s) |
| create |
file already exists |
remove |
| remove |
file does not exist |
create |
| rmdir |
directory not empty |
remove / rmdir |
| getattr |
permission denied |
setattr |
|
Note that there is frequently more than one way to
augment the trace in order to prevent the problem. For example,
if a file cannot be created because it already exists in the file
system, we could either rename the file or remove it.
We cannot determine which of these two operations are missing
(or whether there are additional operations that we missed as well)
but we can observe that removes are almost always more frequent
than renames and therefore always choose to correct this problem
via a remove.
A similar problem is that we cannot accurately determine the correct
timestamp for each corrective operation. Therefore the inserted
operations might not perfectly recreate the action of the missing
packets. There are also lost packets which do not lead to replay
failures and therefore cannot be detected.
Since the overall number of lost RPC messages is small
(approaching 10% only in extreme situations, and typically
about 1%), and most of them are operations
which do not require corrective operations such as readdir
read, getattr and lookup,
the total number of corrective operations is always much smaller (about 0.05%)
than the operations taken verbatim from the original trace.
Potential replay failures are detected and corrected through a
simulated pre-play. The pre-play executes the trace requests
one-by-one synchronously. Replay failures are detected by comparing
the return value of original request in the trace and the return value
of pre-play. The corrective operations are generated according to the
trace correction table and are inserted into the trace
with a timestamp randomly selected from its valid range.
3.2 Creating the Initial File System Image
To replay calls from a file access trace, the tested server must be
initialized with a file system image similar to that of the traced
server so that it can respond correctly to the trace requests. There
are two factors to be considered while creating the initial file
system image: the logical file system hierarchy and the physical disk
layout. While the former is essential for correct trace replay, the
latter is crucial to the performance characteristics of the file
system. Ideally, one could take a file system snapshot of the traced
server before a trace is collected. In practice, however, this is
often impractical because it may cause service degradation. Moreover,
most file system snapshotting tools capture only the file system
hierarchy but not the physical layout. TBBT approximates the traced
server's file system image using information from the NFS trace. It
then constructs (and ages) the image through the native file system of
the tested server.
The idea of extracting the file system hierarchy from an NFS trace is
not new [4,8]. However, because earlier
tools were developed mainly for the purpose of trace studies, the
extracted file system hierarchy is not sufficiently complete to permit
trace replay. For example, operations such as symlink, link and rename were not handled properly, and the dynamic
changes to the file system hierarchy during tracing are not properly
captured.
TBBT's file system hierarchy extraction tool produces a hierarchy
map. Each entry in the hierarchy map contains a TBBT-ID, path, createTime, deleteTime, size, and type.
Each hierarchy map entry corresponds to one file system object under
one path. File system objects with multiple hard links have multiple
paths and may appear in multiple hierarchy map entries, but have the same
TBBT-ID in each entry. If a path exists before trace collection
starts, its createTime is set to 0 (to indicate that TBBT must create
this object before the trace replay begins), and the size field
gives the object's size at the time when the trace began. The type
field indicates whether the file is a regular file, a directory, or a
symbolic link.
The file system hierarchy extracted from an NFS trace is not
necessarily a complete snapshot of the traced file system because only
files that are referenced in the trace appear in the TBBT hierarchy map and many workloads are highly localized. In traces
gathered from our own systems, we observed that in many cases only a
small fraction of a file system is actually accessed during the course
of a day (or even a month). The fact that only active files appear in
the TBBT hierarchy map may have a serious effect on the locality
of the resulting file system. To alleviate this problem, TBBT
augments the extracted file system hierarchy with additional files.
Details about how these objects are created are given in Section 3.3.2.
Given a TBBT hierarchy map, TBBT populates the tested server file
system according the order that files appeared in the hierarchy map,
creating each file, directory, or link as we encounter it.
Usually files in the hierarchy map are organized in depth-first
order, but it could be in other order too, as long as a file appears
later than its parent directory.
This naive approach yields a nearly ideal physical disk layout for the
given file system hierarchy: free space is contiguous, data blocks of
each file are allocated together and therefore likely to be physically
contiguous, data is close to the corresponding metadata, and files
under the same directory are grouped together. As a result, it does
not capture the effects of concurrent access and file system aging.
TBBT's artificial aging technique is designed to emulate such aging.
3.3 Artificially Aging a File System
The effect of aging centers on fragmented free space, fragmented
files, and declustered objects (objects which are often accessed
together but are located far from each other on the disk).
TBBT's aging mechanism is meant to create such aging effects.
The current implementation and evaluation
focuses on the fragmentation of file blocks and free space, but the
mechanism is extensible to include the declustering effect among related
file system objects.
TBBT's aging mechanism is purely synthetic and is not meant to emulate
the actual file system aging process (as done in Keith Smith's
work [20]).
An important design constraint of TBBT's file system aging mechanism
is that it should be able to exercise any desired aging effects
against any file system without resorting to the raw disk interface.
Using only the standard system call interface makes it easier to integrate
a file system aging mechanism into other file system benchmarking tools.
Aging is related to the file system block allocation algorithm. Some
of our analyses assume a FFS-like block allocation policy. This
policy divides a disk partition into multiple cylinder groups,
each of which has a fixed
number of free inodes and free blocks. Files under the same directory
are preferentially clustered in one group.
Our aging techniques are expected to work well for servers utilizing
FFS-like file systems on simple block storage. Other types of systems
have not yet been tested.
To the best of our knowledge, there do not exist any standard metrics
to quantify the effect of aging on a file system. Before presenting our file
system aging metrics, we define several basic terms used in
our discussion.
A file system object is a regular file, directory, symbolic
link, or a special device. The free space object is an abstract
object that contains all of the free blocks in the file system. A
fragment is a contiguous range of blocks within an object. The
fragment size is the number of blocks within a fragment, and the
fragment distance is the number of physical blocks between two
adjacent fragments of the same object. The block distance is
the number of physical blocks between two adjacent logical blocks in an object. The
inode distance is the number of physical blocks between an
object's inode and its first data block and the parent distance is
the number of physical blocks between the first block of an object and
that of its parent directory. The block used in these definitions is
file system block (4KB by default).
If we assume that the goal of the policy used to allocate blocks for a file
is to allocate them sequentially, then the effect of file system aging
(in terms of the fragmentation it causes)
can be quantified in terms of the physical distance between
consecutive blocks of a file.
Average fragment distance, average block distance and
average fragment size are
calculated over all fragments/blocks
that belong to each file within a file system partition,
and are related to one another as follows:
average fragment distance =
average block distance average fragment size.
Because the calculation of these metrics is averaged over the number of
blocks or segments in a file,
files of different size are weighted accordingly.
Average block distance describes the overall degree of file
fragmentation. Either of the other two metrics
helps further distinguish between the following two types of fragmentation:
a large number of small fragments that are located relatively close to
each other, or a small number of large fragments that are located far away from each other.
Average inode distance can be considered as a special case of average block distance
because it measures the distance between a file's inode and its first data block. average fragment size.
Because the calculation of these metrics is averaged over the number of
blocks or segments in a file,
files of different size are weighted accordingly.
Average block distance describes the overall degree of file
fragmentation. Either of the other two metrics
helps further distinguish between the following two types of fragmentation:
a large number of small fragments that are located relatively close to
each other, or a small number of large fragments that are located far away from each other.
Average inode distance can be considered as a special case of average block distance
because it measures the distance between a file's inode and its first data block.
In an aged file system, both free space and allocated space are
fragmented. The average fragment size of the special free
space object reflects how fragmented the free space portion of a file
partition is. The file system aging effect can also be quantified
based on the degree of clustering among related files, e.g., files
within the same directory. The average parent distance is meant
to capture the proximity of a directory and the files it contains, and
indirectly the proximity of files within the same directory.
Alternatively, one can compute average sibling distance
between each pair of files within the same directory.
These metrics provide a simplistic model;
they do not capture the fact that logical block distances do not
equate to physical seek time nor do they reflect the
non-commutative nature of rotational delays, which
make it common for disk head to take a different amount of
time to move from position A to position
B than from B to A. This simplistic model does have
several benefits, however: it is both device and
file-system independent, and does provide intuition
for the file system performance.
3.3.2 File System Aging Techniques
Free space fragmentation is due primarily to file deletions. Fragmented
files, in contrast, are caused by two reasons. First, a file will
become fragmented when free space is fragmented and there
are no contiguous free blocks to allocate when the file grows.
Second, interleaving of append operations to several files
may cause blocks associated with these different files to be
interleaved as well. There are several techniques that mitigate the
fragmentation effect of interleaved appends, such as dividing a
logical partition into cylinder groups and placing files in different
cylinder groups [14]. Another heuristic is to preallocate
contiguous blocks when a file is opened for writing. Despite these optimizations,
files can still get fragmented if interleaved appends occur within the
same group or if the file size is more than the pre-allocated size.
The aging effects become more pronounced when inode and block utilization
is unbalanced between cylinder groups. To reduce the declustering effect,
an FFS-like policy tries to place files under the same directory in one group,
and to allocate one file's inode and its data blocks in the same group.
But it also tries to keep balanced utilizations among different cylinder groups.
Once the utilization of a group is too high, allocation switches to
another group unless there are no available cylinder groups. The unbalanced usage
is usually caused by a highly skewed directory tree where some
directory has many small files or some directory has very large files.
TBBT uses interleaved appending as the primary file system aging
technique, and uses file deletion only to fragment the free space.
Given a file system partition, TBBT's initialization procedure
populates it with the initial file system hierarchy derived from the
input trace and additional synthetic objects to fill all available
space. These synthetic objects are used both to populate the
incomplete file system hierarchy and to occupy free space. All of the
objects become fragmented because of interleaved appending. At the end
of the initialization, the synthetic objects that occupy the free space are
deleted to have fragmented free space available. This way, to
initialize a 1GB file system partition with 0.1GB free space, we write
exactly 1GB of data, then we delete 0.1GB of data. In contrast,
Smith's aging technique writes around 80GB of data, and deletes
around 79GB of data.
Note that our choice of terminology and
examples in this discussion assumes that the underlying file system
uses an FFS-like strategy for block allocation. We believe that our methodology works
just as well with other strategies, such as LFS, although for LFS
instead of fragmenting the free space, we are creating dead blocks for
the cleaner to find and reorganize.
To determine the set of synthetic objects to be added to a file system
and generate a complete TBBT hierarchy map, TBBT takes four parameters.
The first two parameters
are file size distribution and directory/file ratio,
which are similar to SPECsfs's file system initialization parameters.
The third parameter is the distortion factor, which determines
the degree of imbalance among directories in terms of directory fan-out
and the file size distribution within each directory. The fourth
parameter is the merge factor, which specifies
how extensively synthetic objects are commingled with the initial file system
image. A low merge factor means that most directories are dominated by
either synthetic or extracted objects, but not both.
To create fragmentation, TBBT interleaves the append operations to a set of files,
and in each append operation adds
blocks to the associated file. To counter the file
pre-allocation optimization technique, each append operation is performed
in a separate open-close session. File blocks written in an
append operation are likely to reside in contiguous disk blocks.
However, blocks that are written in one append
operation to a file may be far away from those blocks
that are written in another append operation to the same file.
The expected distance between consecutive fragments of the same file
increases with the total size of files that are appended concurrently.
By controlling the total size of files involved in interleaved appending,
called interleaving scope, and the number of blocks in each append operation, TBBT can control
the average block distance and average fragment size of the resulting
file system.
We assume that large files tend to be written in larger chunks.
Instead of directly using the number of blocks
in each appending operation to tune average fragment size, we
use a parameter called append operations per file, which specifies
the number of appending operations used to initialize one file.
The minimum size of each fragment is 1 block. Usually
the average file size is around 10 blocks. Therefore,
a very large value of append operations per file may only affect
some large files.
The declustering effect is described by average inode distance
and average parent/sibling distance. To create the declustering effect,
TBBT may add zero-sized synthetic objects to create a skewed directory hierarchy
and provoke unbalanced usage among cylinder groups. To increase the
average parent/sibling distance, rather than picking files at random,
TBBT interleaves files from different directories.
In summary, given a TBBT hierarchy map, TBBT's file system aging
mechanism tries to tune: average block distance and
average fragment size of normal file, average fragment size of the special
free space object, average inode distance and
average parent/sibling distance.
Average block distance is tuned via the interleaving scope.
Average fragment size is tuned via the append operations per file.
Moreover, different aging effects could be specified
for different files, including the special free space object.
We have not implemented the controls for average inode distance and
average parent/sibling distance in the current TBBT prototype.
Randomization is used to avoid regular patterns.
TBBT's aging technique can be used to initialize the file system image for
both trace-based and synthetic workload-based benchmarking.
3.4 Trace Replay
When replaying the requests in an input trace, TBBT needs to respect
the semantics of the NFS protocol. Sending out requests according to their timestamps
is not always feasible. For example, given sequence1 in Table 3,
if the create reply comes at time 3 during the replay, it
is impossible to send the write request at time 2. TBBT's trace player
provides flexible policies to handle the issue of when it is correct to send a request.
For SPECsfs-like synthetic benchmarks, multiple processes are used to
generate requests against multiple disjoint directories, and in each
process requests are executed synchronously without any concurrency.
As a result, the SPECsfs load generation policy is much simpler.
3.4.1 Ordering and Timing Policy
TBBT's trace player provides two ordering policies to determine the relative
order among requests:
conservative order and FS dependency order.
Both guarantee the replay can proceed to the end, and both result in
same modifications to the initial file system hierarchy at the end of trace play.
TBBT also provides two
timing policies: full speed and
timestamp-based, to determine the exact time at which requests
are issued. In the full speed policy, requests are dispatched
as quickly as possible, as long as the chosen ordering policy is obeyed.
In the timestamp based policy, requests are dispatched
as close to their timestamp as possible without violating the
ordering policy.
Table 3:
Examples to illustrate the ordering issue in trace replay.
The first column represent normalized time. Other columns represent
NFS request sequence examples.
The create latency is 1 on the traced server and 3 on the
tested server. In Sequence1 there is
FS-level dependency because both operations involves the same
file. In Sequence2 there is no FS-level dependency but may
an have application-level dependency. Sequence3 is the result of
replaying sequence2 by conservative order. Sequence4 is the result of playing
sequence2 by FS dependency order.
| T |
sequence1 |
sequence2 |
sequence3 |
sequence4 |
| 0 |
create A call |
create A call |
create A call |
create A call |
| 1 |
create A reply |
create A reply |
|
write B call |
| 2 |
write A call |
write B call |
|
write B reply |
| 3 |
write A reply |
write B reply |
create A reply |
create A reply |
| 4 |
|
|
write B call |
|
| 5 |
|
|
write B reply |
|
|
When the conservative order policy is used, a request is issued only
after all prior requests (e.g., requests with earlier timestamps)
have been issued and all prior replies have been received.
The conservative order captures some of the concurrency inherent in
the trace although it will not generate a workload with higher concurrency.
In contrast, there is no concurrency in the workload generated by each process
of SPECsfs's load generator.
Because of differences in the traced server and tested server,
it is impossible to guarantee that the order of replies in the trace replay
is exactly the same as that in the trace. The disadvantage
of conservative order is that processing latency variations in the tested
server may unnecessarily affect its
throughput. For example, given sequence2 of Table 3,
if the create latency during replay is three times higher
than the latency in the original trace, the request issue ordering
becomes sequence3 which has a lower throughput than sequence2.
In the FS dependency order policy,
the dependencies of each request on other earlier requests and replies
in the trace are discovered via
a read/write serialization algorithm.
With the FS dependency order policy,
the request issue ordering for sequence2 in Table 3
becomes sequence4, which results in higher throughput than sequence3.
Conceptually, the file system
hierarchy is viewed as a shared data structure and each NFS request is a
read or write operation on one or more parts of this structure.
If an NFS operation modifies some part of the structure that is accessed
by a later operation in the trace, then the latter operation cannot
be started until the first has finished.
For example, it is dangerous to overlap a request to create a file
and a request to write some data to that file; if the write request
arrives too soon, it may fail because the file does not yet exist.
In many cases it is not necessary to wait for the response, but
simply to make sure that the requests are made in the correct
order. The exceptions are the replies from create, mkdir,
symlink, and mknod.
These replies are regarded as a write operation to the newly created object,
and therefore need to be properly serialized with respect to
subsequent accesses to these newly created
objects. Table 4 summarizes the file system objects that
are read or written by each type of request and reply. Because concurrent
access to the same file system object is infrequent in real
NFS traces, the granularity of TBBT's dependency
analysis is an individual file system object.
For finer-granularity dependency analysis, inode attributes
and each file block could be considered separately.
The FS dependency order may be too aggressive because it
only captures the dependencies detectable through the shared
file system data structure but does not discover application-level dependencies.
For example, in Table 3, if the application logic
is to write some debug information to the log file B after each
successful create A operation, then the write operation indeed
depends on the create operation and should be sent after receiving the
create request's reply. In this case, ordering requests based FS-level dependencies
is not sufficient. In general,
conservative order should be used when FS dependency order
cannot properly account for many application-level dependencies.
Table 4:
The file system objects that are read or written by different
requests and replies. The notation [obj] means that the
object may not exist and therefore the associated operation
might return a failure.
| request/reply |
shared-data-structure set |
type |
| REQ : read/readdir/getattr/readlink obj |
obj |
'read' |
| REQ : write/setattr/commit obj |
obj |
'write' |
| REQ : lookup parent, name([obj]) |
parent, [obj] |
'read' |
| REQ : create/mkdir parent, name |
parent |
'write' |
| REPLY: create/mkdir obj |
obj |
'write' |
| REQ : remove/rmdir parent, name([obj]) |
parent, [obj] |
'write' |
| REQ : symlink parent, name, path |
parent |
'write' |
| REPLY: symlink [obj] |
[obj] |
'write' |
| REQ : rename parent1, name1, parent2, name2([obj2]) |
parent1, parent2, [obj2] |
'write' |
| all other replies |
empty |
- |
|
Given a trace, TBBT can scale it up or down spatially or temporally.
To spatially scale up a trace, the trace and its initial file system image
are cloned several times, and each
cloned trace is replayed
against a separate copy of the initial image. Spatial scale-up
is analogous to the way that synthetic benchmarks run multiple load-generation processes.
To spatially scale down a trace, the trace is decomposed into multiple sub-traces, where each
sub-trace accesses only a proper subset of the initial file system image.
Not all traces can be easily
decomposed into such sub-traces, but it is typically not a problem for traces
collected from file servers that support a large number of clients and users.
Users don't often share any files and we can just take a subset of them.
Temporally scaling up or down a trace is implemented by issuing the requests
in the trace according the scaled timestamp, while observing
the chosen ordering policy. An ordering policy from above bounds the
temporal scaling of a given trace.
The two scaling approaches can be combined to scale a trace. For example, if the
required speed-up factor is 12, it can be achieved by a spatial scale-up
of 4 and a temporal scale-up of 3.
4 Implementation
Trace transformation and initial file hierarchy extraction are implemented in Perl.
Trace replay is implemented in C.
Each trace is processed in three passes.
The first pass transforms the collected trace into TBBT's trace format,
except the TBBT-ID field in the replies to remove, rmdir, and rename.
The second pass corrects trace errors by a pre-play of the trace.
The third pass extracts the hierarchy map and adds the TBBT-ID
to the replies to remove, rmdir, rename. Each successful or
failed directory operation may contain information about a
parent, child relationship from which the hierarchy map is built. Hierarchy
extraction consumes a great deal of CPU and memory, especially for
traces of large size. An incremental version of hierarchy extraction
is possible and will greatly improve its efficiency.
Figure 1:
SPECsfs uses multiple independent processes to generate
requests targeted at disjoint directories.
 |
Figure 2:
TBBT uses a three-thread process to read and replay
traces stored on disk.
 |
Similar to SPECsfs [21], TBBT's trace player
bypasses the NFS client and sends NFS requests directly
to the tested file server using user-level RPC.
The software architecture of the TBBT player, however, is different from
SPECsfs. As shown in Figure 1, the workload
generator of SPECsfs on each client machine uses a multi-process
software architecture, with each process dispatching NFS requests
using synchronous RPC. In contrast, TBBT uses a 3-thread software
structure, as shown in Figure 2, which is more
efficient because it reduces the context switching and scheduling
overhead. The I/O thread continuously reads trace records into a
cyclic memory buffer called the operation queue. The send
thread and receive thread send NFS requests to and receive
their replies from the NFS server under test using asynchronous RPC
requests. The operation queue is also called the lookahead window.
The size of the lookahead window should be several times
larger than the theoretical concurrency bound of the input trace to
ensure that the send thread is always able to find enough
concurrent requests at run time.
The send thread determines whether an NFS request in the input
trace is ready to be dispatched by checking (1) whether it follows
the ordering policy
(2) whether the request's timestamp is larger than the current time-stamp,
and (3) whether the number of outstanding requests to a given server
exceeds the given threshold. The second check is only for timestamp-based
policy. The third is to avoid overloading the test file server.
The first check is straightforward in the case of conservative order.
For FS dependency order, we use object locking
as illustrated in Figure 2. Before dispatching an
NFS request, the send thread acquires the read/write lock(s) on
all the object(s) associated with the request (and the reply for operations
that refer to additional objects in their reply).
Some locks are released
after the request is dispatched, other locks are released after
the reply is received.
During trace replay, requests are pre-determined, rather than
computed on the fly according to current replay status, as in some
synthetic benchmarks. This means that a robust trace player needs to
properly react to transient server errors or failures in such a way
that it can continue to play the trace for as long as possible. This
requires the trace player to identify subsequent requests in the trace
that are affected by a failed request, directly or indirectly, and
skip them, and to handle various run-time errors such that their side
effects are effectively contained. For example, because a create request is important for a trace replay to continue, it
will be retried multiple times if the request fails; however, a
failed read request will not be retried so as not to disrupt the
trace replay process.
5 Evaluation
In this section, we examine the validity of the trace-based file
system benchmarking methodology, analyze to what extent we may
scale the workload, explore the difference between the
evaluation results from TBBT and SPECsfs and conclude with
a measure of the run-time cost of our TBBT prototype.
The NFS traces used in this study were collected from the EECS NFS
server (EECS) and the central computing facility (CAMPUS) at Harvard
over a period of two months in 2001 [7]. The EECS
workload is dominated by metadata requests and has a read/write ratio
of less than 1.0. The CAMPUS workload is almost entirely email and is
dominated by reads. The EECS trace and the CAMPUS trace grow
by 2 GBytes and 8 GBytes per day, respectively. Most of the Harvard
traces have a packet loss ratio of between 0.1-10%.
We use TBBT to drive two NFS servers. The first is the Linux NFSv3
and the second is a repairable file system called RFS. RFS augments a
generic NFS server with fast repairability without modifying the NFS
protocol or the network file access path [24]. The same
machine configuration is used for post-collection trace processing,
hosting the test file systems, and running TBBT trace player and
SPECsfs benchmark. The machine has a 1.5-GHz Pentium 4 CPU, 512-MByte
of memory, and one 40-GByte ST340016A ATA disk drive with 2MB on-disk
cache. The operating system is RedHat 7.1.2 with Linux kernel 2.4.7.
An ideal trace analysis and replay tool should be able to faithfully
recreate the initial file system image and its disk layout, and replay
back the requests in the trace with accurate timing. In this section,
we evaluate how successful TBBT is in approximating this ideal.
Because the Buttress [2] project has already solved the trace replay
timing problem, this issue is omitted here.
5.1.1 Extraction of File System Hierarchy
We measured the number of disjoint directory subtrees, the number of
directories, the number of files, and the total file system size of the
derived file system hierarchy.
Figure 3
shows the results for the EECS trace
from 10/15/2001 to 10/29/2001.
The Y-axis is in logarithmic scale.
The total file system size on the EECS server is 400 GB, but only 42 GB
is revealed by this 14-day trace (and most of this is discovered during
the first several days).
We expect the rate will further slow if additional weeks are added.
Part of the reason that the extracted hierarchy is incomplete is because
this file server has 2 network access interfaces and the NFS traces are
collected from only one of the interface. Another reason is that
the backup traffic is filtered out of the traces. If they had not been
filtered out, then capturing a full backup would give an excellent picture.
In general, our results indicate
that when the initial file system hierarchy is not available, the hierarchy
extracted from the trace may be only a small fraction of the real hierarchy
and therefore it is essential
to introduce artificial file objects in order to have comparable disk layout.
In the following experiments, both file system and disk prefetch are
enabled, and the file system aging metrics are calculated using disk
layout information obtained from the debugfs utility available
for the ext2 and ext3 file system. We applied our aging technique to
two test file systems.
The first is a researcher's home directory (which has
been in continuous use for more than 1.5 years) and the second is the
initial file system image generated by the SPECsfs benchmark.
From the researcher home directory, we selected two subdirectories, dir1 and dir2, and for each subdirectory, created three different
versions of the disk image. The first version is a naturally aged
version, which is obtained by copying the logical partition which contains
the original subdirectory to another logical partition using dd.
The second version is a synthetically
aged version, which is created through our aging techniques.
The third version represents
a linearized version of the original subdirectory's disk image using
cp -r and thus also corresponds to a near-optimal disk image
without aging effect.
The file system buffer cache is purged before each test.
For each of the three versions of each
subdirectory, we measure the elapsed time of the command grep -r, which is a disk-intensive command that typically spends at least 90%
of its execution time waiting for the disk.
Therefore, aging is expected to have a direct
effect on the execution time of the grep command.
Figure 3:
The file system hierarchy size
discovered over time. Longer traces provide more
information about the file system hierarchy, but with rapidly diminishing
returns.
 |
Figure 4:
The elapsed time to complete grep -r on dir1 consistently increases with the interleaving scope
and the append operations per file parameter. Different
curves corresponding to different values of the append
operations per file parameter.
For example, ``A = 8'' means the append operations per file is 8.
The lines for the naturally aged and linearized image are flat because no
synthetic aging is applied to these two cases.
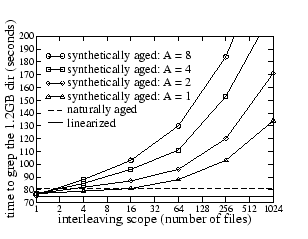 |
Figure 5:
This figure shows the result of conducting a similar experiment as
Figure 4 on a much larger research project directory.
The two figures show that the aging parameters create qualitatively
similar but quantitatively different aging effects on different file system data.
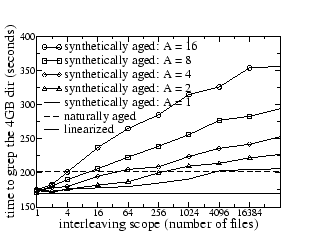 |
Figures 4 and 5
show that the proposed aging technique has the anticipated
impact on the performance of grep for dir1 and dir2:
more interleaving and finer-grained appends result in more fragmentation
in the disk image, which leads to lower performance.
Moreover, with the proper aging parameters, it is actually possible to
produce a synthetically aged file system whose grep performance is the same
as that of the original naturally aged file system.
For Figure 4, the interleaving scope,
append operations per file pairs that correspond to these
cross-over points are 2,8, 4,2, and 16,1.
For Figure 5, the interleaving scope,
append operations per file pairs that correspond to these
cross-over points are 4,16, 16,8, 64, 4, 256, 2, and 4096, 1.
These results demonstrate that the proposed aging technique can indeed
produce a realistically aged file system image. However, the question
of how to determine aging parameters automatically remains open.
Figures 4 and 5 also show that
the grep performance of
the original naturally-aged image is not very different from that of
the linearized image; the impact of
natural aging is not more than 20%.
TBBT's aging technique can generate much more dramatic aging effects, but
it is not clear whether such aging occurs in practice.
To show that the proposed aging technique can be used together with a synthetic
benchmark such as SPECsfs,
we run the SPECsfs benchmark on the image initialized by SPECsfs itself
and the image initialized by the aging technique with different parameters.
We used the append operations per file value of 4 and varied the
interleaving scope value, and measured the average read latency and
the initial image creation time.
The results are shown in Table 5.
As expected, the average read latency increases as the initial file
system image is aged more drastically.
The first two rows show that the SPECsfs benchmark run itself increases the
average block distance too and the increase is more observable when the
initial image is less aged (first two columns).
Finally, the time required to create an initial file
system image in general increases with the degree of aging introduced.
From the table, TBBT initialization is faster than SPECsfs.
The reason could be that SPECsfs uses concurrent initialization
processes and the overall disk access pattern does not have as good locality
as the single-threaded TBBT initialization procedure.
Table 5:
Results of applying the proposed file system aging techniques
to SPECsfs. First column gives result of using SPECsfs's own
initialization procedure. Other three columns show the result
of using TBBT's aging technique to create SPECsfs run's
initial file system image.
|
SPECsfs initialization |
scope=512 |
scope=8192 |
scope=65536 |
| average block distance before SPECsfs run |
2 |
20 |
2180 |
6230 |
| average block distance after SPECsfs run |
817 |
828 |
2641 |
6510 |
| average read latency |
3.24 msec |
3.24 msec |
3.31 msec |
4.45 msec |
| time to create initial image |
683 sec |
330 sec |
574 sec |
668 sec |
|
Figure 6:
The impact of the lookahead window size on the concurrency
and thus the throughput of the workload that TBBT can generate from the EECS and CAMPUS trace.
 |
To study the maximum concurrency
available in a trace, we conducted a simulation study.
The simulation assumes the reply for each request always comes back successfully after
a pre-configured latency. The throughput result is given in
Figure 6.
In this simulation, there are two factors that limit the maximum concurrency:
the lookahead window in which future requests are examined during
the simulation, and the per-request latency at the server.
For per-request latency, we used the
latency numbers in Table 6.
Figure 6 shows the correlation between the maximum
throughput that can be generated and the lookahead window size.
The simulation results show that even for a lightly loaded workload such as
the EECS trace (30 requests/sec) and a modest lookahead window size
(4000), there is enough concurrency to drive a file server with a performance
target of 37000 requests/sec using temporal scaling.
Table 6:
Per-operation latency and overall throughput(operations per second) comparison
between TBBT and SPECsfs for an NFS server
using the EECS 10/21/2001 trace.
``T'' means TBBT, ``S'' means SPECsfs.
| NFS 10/21/01 |
original |
scale-up |
peak load |
| benchmark |
S |
T |
S |
T |
S |
T |
| throughput (Ops) |
33 |
30 |
189 |
180 |
1231 |
1807 |
| getattr (msecs) |
5.1 |
0.6 |
0.9 |
1.5 |
2.1 |
0.7 |
| lookup (msecs) |
2.9 |
0.9 |
0.8 |
2.0 |
2.0 |
1.2 |
| read (msecs) |
9.6 |
3.1 |
5.3 |
4.8 |
5.4 |
4.7 |
| write (msecs) |
9.7 |
2.2 |
4.4 |
3.8 |
4.6 |
2.5 |
| create (msecs) |
0.5 |
0.7 |
0.7 |
0.9 |
17.3 |
0.7 |
|
We conducted experiments to evaluate two file servers: NFS and RFS
using both TBBT and the synthetic benchmark SPECsfs. In these experiments,
the tested file system is properly warmed up before performance
measurements are taken.
We first played the EECS trace of 10/21/2001, and tried to
tune the parameters of the SPECsfs benchmark so that they match
the trace's characteristics as closely as possible.
We also changed the source code of SPECsfs so that its file size distribution
matches the file size distribution in the 10/21/2001 trace.
The maximum throughput of the Linux NFS server under SPECsfs is 1231
requests/sec, and is 1807 requests/sec under TBBT. The difference is
a non-trivial 46.8%. In terms of per-operation latency, Table
6 shows the latency of five different
operations under the original load (30 requests/sec), under a temporally
scaled load with a speed-up factor of 6, and under the peak load.
The per-operation latency numbers for TBBT and for SPECsfs are qualitatively
different in most cases.
Table 7:
Performance results for RFS server using the EECS 10/21/2001 trace.
| RFS 10/21/01 |
original |
scale-up |
peak load |
| benchmark |
S |
T |
S |
T |
S |
T |
| throughput (Ops) |
32 |
30 |
187 |
180 |
619 |
1395 |
| getattr (msecs) |
4.0 |
0.7 |
2.2 |
1.2 |
3.2 |
0.8 |
| lookup (msecs) |
4.4 |
0.7 |
2.8 |
1.3 |
2.6 |
1.0 |
| read (msecs) |
10.8 |
3.3 |
8.4 |
4.1 |
18.1 |
4.9 |
| write (msecs) |
11.6 |
5.4 |
7.4 |
4.0 |
11.1 |
2.8 |
| create (msecs) |
0.7 |
1.0 |
5.1 |
1.3 |
16.3 |
1.2 |
|
Table 8:
Performance results for NFS server using the EECS 10/22/2001 trace.
| NFS 10/22/01 |
original |
scale-up |
peak load |
| benchmark |
S |
T |
S |
T |
S |
T |
| throughput (Ops) |
16 |
15 |
191 |
187 |
2596 |
4125 |
| getattr (msecs) |
4.7 |
0.5 |
0.7 |
0.7 |
1.02 |
0.7 |
| lookup (msecs) |
2.8 |
0.6 |
0.5 |
0.8 |
1.01 |
0.6 |
| read (msecs) |
10.3 |
2.1 |
19.7 |
3.1 |
7.4 |
4.2 |
| write (msecs) |
7 |
1.0 |
6.3 |
1.2 |
3.8 |
3.0 |
| create (msecs) |
0.5 |
0.9 |
1.2 |
0.5 |
7.9 |
0.7 |
|
The same experiment, using RFS instead of the Linux
NFS server, is shown in Table 7. The maximum throughput
is 619 requests/sec for SPECsfs versus 1395
requests/sec for TBBT - a difference of 125.4%.
Again there is no obvious relationship between the
average per-operation latency for SPECsfs and TBBT.
To determine whether these differences are consistent across traces
taken from different days, we ran the
10/22/2001 EECS trace against the LINUX NFS server. The 10/22/2001 trace
is dominated by metadata operation (80%) while the 10/21/2001 trace
has substantial read/write operations (60%). The SPECsfs
configuration is again tuned to match the access characteristics of
the 10/22/2001 trace. The results in Table 8
show that the difference between TBBT and SPECsfs in throughput and
per-operation latency is still quite noticeable.
TBBT's post-collection trace processing procedure can process 2.5
MBytes of trace or 5000 requests per second.
TBBT's initialization time
increases with the total file system size as well as the degree of
file system aging desired, because the more drastic the aging effect TBBT
attempts, the less is the disk access locality in its file system
population process. Table 5 shows TBBT's initialization
time is also affected by
and average block distance level. Overall TBBT's aging
techniques is very efficient. The initialization speed is more than
two orders of magnitude faster than Smith's aging technique.
The CPU load of TBBT comes from the send thread, receive thread, and
the network subsystem inside the OS. When the Linux NFS server runs
under a trace at peak throughput (1807 requests/sec), the measured CPU
utilization and network bandwidth consumption for TBBT's trace player
are 15% and 60.5 Mbps. When the same Linux NFS server runs under a
SPECsfs benchmark at peak throughput (1231 requests/sec), the measured
CPU utilization and network bandwidth consumption for the SPECsfs
workload generator are 11% and 37.9 Mbps.
These results suggest that
TBBT's trace player is actually more efficient than SPECsfs's workload
generator (in terms of CPU utilization per NFS operation) despite the
fact that TBBT requires additional disk I/O for trace reads, and
incurs additional CPU overhead for dependency detection and error
handling. We believe that part of the reason
is because TBBT uses only three threads, whereas SPECsfs uses multiple processes.
6 Limitations
There are several limitations associated with the proposed trace-driven
approach to file system evaluation. First, for a given input workload,
TBBT assumes the trace gathered from one file system is
similar to that from the file system under test. Unfortunately, this assumption
does not always hold, because even under the same client
workload, it is possible that different file servers based on the same
protocol produce very different traces. For example, file mount parameters
such as read/write/readdir transfer sizes could have a substantial impact
on the actual requests seen by an NFS server.
Second, there is no guarantee that the
heuristics used to scale up a trace are correct in practice.
For example, if the bottleneck of a trace
lies in accesses to a single file or directory, then cloning
these accesses when replaying the trace is not feasible.
Third, it is generally not possible to deduce the entire file system
hierarchy or its on-disk layout by passive tracing. Therefore the best
one can do is to estimate the size distribution of those files that are never
accessed during the tracing period and to apply synthetic aging
techniques to derive a more realistic initial file system image.
Again the file aging techniques proposed in this paper are not meant to
reproduce the actual aging characteristics of the trace's target file system,
but to provide users the flexibility of incorporate some file aging effects
in their evaluations.
Fourth, trace-based evaluation is not as flexible
as those based on synthetic benchmarks, in terms of the ability to explore
the entire workload space. Consequently, TBBT should be used to complement
synthetic benchmarks rather than replace them.
Finally, TBBT replays write request with synthetic data blocks.
This has no effect on a NFS server built on top of a
conventional file system, but is not correct for
storage systems whose behavior depends on the
data being written (i.e., content-addressed storage systems).
7 Conclusion
The prevailing practice of evaluating the performance of a file
system/server is based on synthetic
benchmarks. Modern synthetic benchmarks do incorporate important
characteristics of real file access traces and are capable of generating file
access workloads that are representative of their target
operating environments. However, they rarely fully capture the
time-varying and oftentimes subtle characteristics of a specific site's workload.
In this paper, we advocate a complementary trace-driven file system evaluation
methodology, in which one evaluates the performance of a file
system/server on a site by driving it with file access traces collected from that site.
To support this
methodology, we present TBBT, the first comprehensive NFS trace analysis
and replay tool. TBBT
is a turn-key system that can take an NFS trace, properly
initialize the target file server, drive it with a scaled version of
the trace, and report latency and throughput numbers.
TBBT addresses most, if not all, of the
trace-driven workload generation problems, including correcting
tracing errors, automatic
derivation of initial file system from a trace, aging the file system
to a configurable extent, preserving the dependencies among trace requests
during replay, scaling a trace to a replay rate that can be
higher or lower than the speed at which the trace is collected,
and graceful handling of trace collection errors and implementation bugs
in the test file system/server. Finally, we show that all these features
can be implemented efficiently such that
a single trace replay machine can stress
a file server with state-of-the-art performance.
In addition to being a useful tool for file system researchers,
perhaps the most promising application of TBBT is to use it as a
site-specific benchmarking tool for comparing competing file servers
using the same protocol.
That is, one can compare two or more file servers for a particular site
by first collecting traces on the site, and then testing the performance
of each of the file servers using the collected traces.
Assuming traces collected on a site are indeed representative of that
site's workload,
comparing file servers
using such a procedure may well be the best possible approach.
TBBT is available at https://www.ecsl.cs.sunysb.edu/TBBT/TBBT_dist.tgz.
We thank Daniel Ellard of Sun Microsystems Laboratories for
his contributions to the TBBT design discussions, his NFS
traces and analysis tools, and his help with early drafts of
this paper.
We thank our shepherd, Rod Van Meter, for his critical opinions, detailed
suggestions and great patience. We thank the
anonymous reviewers for their valuable comments.
We thank our ECSL colleagues for their help in paper writing and
testbed setup.
This research is supported by NSF awards
ACI-0234281, CCF-0342556, SCI-0401777, CNS-0410694 and CNS-0435373
as well as fundings from Computer Associates Inc.,
New York State Center of Advanced Technology in Sensors, National Institute of
Standards and Technologies, Siemens, and Rether Networks Inc.
- 1
-
Darrell Anderson and Jeff Chase.
Fstress: A Flexible Network File Service Benchmark.
Technical Report TR-2001-2002, Duke University, May 2002.
- 2
-
Eric Anderson.
A toolkit for flexible and high fidelity I/O benchmarking.
In Proceedings of the Third USENIX Conference on File and
Storage Technologies (FAST'04), March 2004.
- 3
-
Mary G. Baker, John H. Hartman, Michael D. Kupfer, Ken W. Shirriff, and John K.
Ousterhout.
Measurements of a Distributed File System.
In Proceedings of 13th ACM Symposium on Operating Systems
Principles, pages 198-212, Monterey, CA, October 1991.
- 4
-
Matthew A. Blaze.
NFS Tracing by Passive Network Monitoring.
In Proceedings of the USENIX Winter 1992 Technical
Conference, pages 333-343, San Fransisco, CA, January 1992.
- 5
-
Aaron Brown and Margo Seltzer.
Operating system benchmarking in the wake of lmbench: A case study of
the performance of NetBSD on the Intel x86 architecture.
In Proceedings of the ACM Conference on Measurement and Modeling
of Computer Systems (SIGMETRICS'97), 1997.
- 6
-
Michael D. Dahlin.
A quantitative analysis of cache policies for scalable network file
systems.
In First OSDI, pages 267-280, 1994.
- 7
-
Daniel Ellard, Jonathan Ledlie, Pia Malkani, and Margo Seltzer.
Passive NFS Tracing of Email and Research Workloads.
In Proceedings of the Second USENIX Conference on File and
Storage Technologies (FAST'03), pages 203-216, San Francisco, CA, March
2003.
- 8
-
Daniel Ellard and Margo Seltzer.
New NFS Tracing Tools and Techniques for System Analysis.
In Proceedings of the Seventeenth Annual Large Installation
System Administration Conference (LISA'03), pages 73-85, San Diego, CA,
October 2003.
- 9
-
Steven. L. Gaede.
Perspectives on the SPEC SDET benchmark.
Lone Eagle Systems Inc., January 1999.
- 10
-
Garth A. Gibson, David F. Nagle, Khalil Amiri, Fay Chang, Eugene M. Feinberg,
Howard Gobioff, Chen Lee, Berend Ozceri, Erik Riedel, David Rochberg, and Jim
Zelenka.
File server scaling with network-attached secure disks.
In Proceedings of the 1997 ACM SIGMETRICS International
Conference on Measurement and Modeling of Computer Systems, pages 272-284.
ACM Press, 1997.
- 11
-
John H. Howard, Michael L. Kazar, Sherri G. Menees, David A. Nichols,
M. Satyanarayanan, Robert N. Sidebotham, and Michael J. West.
Scale and Performance in a Distributed System.
ACM Transactions on Computer Systems, 6(1):51-81, February
1988.
- 12
-
Jeffrey. Katcher.
PostMark: A New File System Benchmark.
Technical Report TR-3022, Network Appliance, October 1997.
- 13
-
Richard McDougall.
A new methodology for characterizing file system performance using a
hybrid of analytic models and a synthetic benchmark.
In Work in Progress Session in 3rd Usenix Conference on File and
Storage Technologies, March 2004.
- 14
-
Marshall K. McKusick, William N. Joy, Samuel J. Leffler, and Robert S. Fabry.
A Fast File System for UNIX.
Computer Systems, 2(3):181-197, 1984.
- 15
-
Larry W. McVoy and Carl Staelin.
lmbench: Portable Tools for Performance Analysis.
In USENIX Annual Technical Conference, pages 279-294, 1996.
- 16
-
Michael Mesnier, Eno Thereska, Daniel Ellard, Gregory R. Ganger, and Margo
Seltzer.
File classification in self-* storage systems.
In Proceedings of the International Conference on Autonomic
Computing (ICAC), pages 44-51, May 2004.
- 17
-
J. Ousterhout, H. Da Costa, D. Harrison, J. Kunze, M. Kupfer, and
J. Thompson.
A trace-driven analysis of the UNIX 4.2 BSD file system.
In Proceedings of the Tenth ACM Symposium on Operating Systems
Principles (SOSP'85), pages 15-24, Orcas Island, WA, December 1985.
- 18
-
Drew Roselli, Jacob Lorch, and Thomas Anderson.
A comparison of file system workloads.
In USENIX 2000 Technical Conference, pages 41-54, San Diego,
CA, 2000.
- 19
-
Margo Seltzer, Greg Ganger, M. Kirk McKusick, Keith Smith, Craig Soules, and
Christopher Stein.
Journaling versus Soft Updates: Asynchronous Meta-data Protection in
File Systems.
In USENIX Annual Technical Conference, 2000.
- 20
-
Keith A. Smith and Margo I. Seltzer.
File System Aging - Increasing the Relevance of File System
Benchmarks.
In Proceedings of SIGMETRICS 1997: Measurement and Modeling of
Computer Systems, pages 203-213, Seattle, WA, June 1997.
- 21
-
SPEC SFS (System File Server) Benchmark, 1997.
https://www.spec.org/osg/sfs97r1/.
- 22
-
Werner Vogels.
File System Usage in Windows NT.
In Proceedings of the Seventeenth ACM Symposium on Operating
Systems Principles, pages 93-109, Kiawah Island, SC, December 1999.
- 23
-
Barry L. Wolman and Thomas M. Olson.
IOBENCH: a system independent IO benchmark.
Computer Architecture News, 17(5):55-70, September 1989.
- 24
-
Ningning Zhu and Tzi-cker Chiueh.
Design, implementation, and evaluation of repairable file service.
In Proceedings of the International Conference on Dependable
Systems and Networks (DSN'03), June 2003.
TBBT: Scalable and Accurate Trace Replay
for File Server Evaluation
This document was generated using the
LaTeX2HTML translator Version 2002 (1.62)
Copyright © 1993, 1994, 1995, 1996,
Nikos Drakos,
Computer Based Learning Unit, University of Leeds.
Copyright © 1997, 1998, 1999,
Ross Moore,
Mathematics Department, Macquarie University, Sydney.
The command line arguments were:
latex2html -split 0 -show_section_numbers -local_icons tbbt_fast05_html.tex
The translation was initiated by Ningning Zhu on 2005-10-13
Ningning Zhu
2005-10-13
|