|
| |||||||||||||||||||||||||||||||||||||||||||||||||||
| ||||||||||||||||||||||||||||||||||||||||||||||||||||
|
USENIX 2003 Annual Technical Conference, FREENIX Track — Paper
[USENIX Annual Conference '03 Tech Program Index]
X Window System Network PerformanceKeith Packard Cambridge Research Laboratory, HP Labs, HP keithp@keithp.com - James Gettys Cambridge Research Laboratory, HP Labs, HP Jim.Gettys@hp.com
Abstract:Performance was an important issue in the development of X from the initial protocol design and continues to be important in modern application and extension development. That X is network transparent allows us to analyze the behavior of X from a perspective seldom possible in most systems. We passively monitor network packet flow to measure X application and server performance. The network simulation environment, the data capture tool and data analysis tools will be presented. Data from this analysis are used to show the performance impact of the Render extension, the limitations of the LBX extension and help identify specific application and toolkit performance problems. We believe this analysis technique can be usefully applied to other network protocols.
IntroductionThe X Window System [SG92] was designed to offer good performance over campus area networks for machines and applications in common use in the late 1980's. A major part of the version 11 protocol design was to reduce the effect of network latency and bandwidth on application performance and correctness observed in analysis of X10 programs. Resource ID allocation was moved to the client applications to eliminate synchronous resource creation. Synchronous device grabs were added to provide correct operation of user interfaces when the user could manipulate input devices faster than the applications could respond. The selection mechanism was added to provide a uniform cut&paste model while delaying and optimizing the underlying bulk data transfer. Experience over the last 15 years has shown that further work in this area is possible and desirable. There has previously never been packet level research capturing and analyzing the actual network characteristics of X applications. The best tools available have been dumps of proxy servers showing requests and responses, with no direct correlation with the actual packet level requests/responses and timing that determine network behavior (or on a local machine, context switches between the application and the X server). One of the authors used the network visualization tool when analyzing the design of HTTP/1.1 [NGBS$^+$97]. The methodology and tools used in that analysis involved passive packet level monitoring of traffic which allowed precise real-world measurements and comparisons. The work described in this paper combines this passive packet capture methodology with additional X protocol specific analysis and visualization. Our experience with this combination of the general technique with X specific additions was very positive and we believe provides a powerful tool that could be used in the analysis of other widely used protocols. With measurement tools in hand, we set about characterizing the performance of a significant selection of X applications based on a range of toolkits and using a variety of different implementation techniques. We are specifically interested in the effects of the Render extension's [Pac01] approach to text, and whether the optimizations offered by the Low Bandwidth X (LBX) extension [FK93] [Pac94] were of any use. Specific application performance issues were also discovered and forwarded to the relevant open source projects.
Measuring X PerformanceThe measurements taken span a range of applications, network characteristics and protocol compression techniques.
Selecting Test ApplicationsAn attempt was made to select applications representative of modern X usage. Reasonably current versions of each application were selected from the Debian Linux distribution. One advantage of the passive monitoring technique is the ability to monitor several applications simultaneously and measure the performance of the collection as they interact on the network. This permits the analysis of session startup sequences where many applications are competing for resources. The following applications were measured in this initial work
Mozilla and FontsBecause of the rapid uptake of client-side fonts in application development, Mozilla was the only current application available that supports both core and client-side fonts in the same version. The current Debian Mozilla package provides an alternate version of the key drawing library that controls access to fonts; the only change in the Mozilla configuration required to select which style of fonts to use is to replace this library with the appropriate version. This limits the changes as much as possible which should make the resulting measurements an accurate representation of the difference between the two techniques.
KDE Session and LBXThe XFree86 4.3 releases of the LBX extension and proxy are faulty, causing the KDE session to hang about halfway through the startup process. Some modest attempts to discover the problem did not yield any results and so those values don't appear in the resulting graphs.
Network Performance CharacteristicsFor this study, one goal was to measure the performance impact of latency vs. bandwidth, and so a set of latency and bandwidth values were used and each test run with every pair of latency and bandwidth. The five bandwidths used were 100Mb, 10Mb, 1Mb, 100Kb and 10Kb. The four latencies used were 0.1ms, 1ms, 10ms and 100ms. These latencies represent the time for a packet to traverse through the router in one direction, and so a round trip time would be at least twice that value.
X Protocol EncodingThe X protocol was originally designed to run efficiently over the campus area networks available in the late 1980's, which ran at 10Mb/second. As modem performance improved in the early 1990's it became almost feasible to run X applications over dial-up links. LBX was an effort to improve performance over low-speed/high-latency links. A significant amount of that work was focused on reducing latency effects of slow links without modifying applications. Another major part of the work was in creating custom encodings of X data to reduce the bandwidth required. The latency efforts focused on problems seen when LBX was being designed. How well those efforts carry forward to modern applications is explored in this paper. More recently, network proxy support has been added to the SSH [BS01] protocol enabling X connections to be forwarded through a secure and optionally compressed connection. SSH has no X-specific re-encoding or compression techniques, it simply uses the Gzip [Gai93] compression technique on the datastream when compression is enabled. Measurements using raw X protocol as well as X run through both of these proxies show their effectiveness in improving performance.
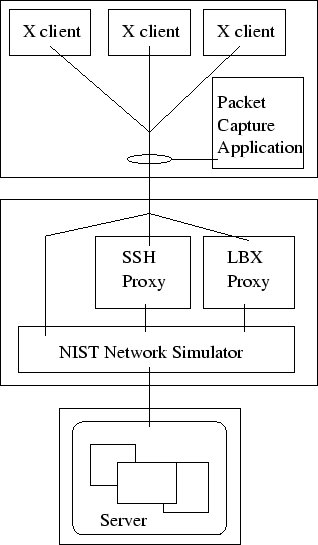
Passive Network AnalysisIn the past, ethernet data monitoring required very little equipment; any host could trivially monitor traffic on the wire from any other host by placing the ethernet hardware in promiscuous mode. Such is not the case today; twisted pair ethernet performance depends on switched connections to provide a collision free link between the two endpoints. The easiest way to monitor the network is to capture packets on one end of the connection. While this may consume some CPU resources, the overhead is minimal given modern machine performance. Alternatively, a ``man in the middle'' machine can be used to capture packet traces between client and server. There are also network switches which can mirror traffic from one port to another, but a single connection cannot reliably hold traffic from a full-duplex link and so packets might be lost or packet ordering scrambled. For either host-based technique, systems are now fast enough that it is possible to capture all packets in most applications without drops. We chose to capture packets on the X client end of the network approach as the network simulator caused problems with capture at the router. The passive capture configuration can be see in Figure 1.
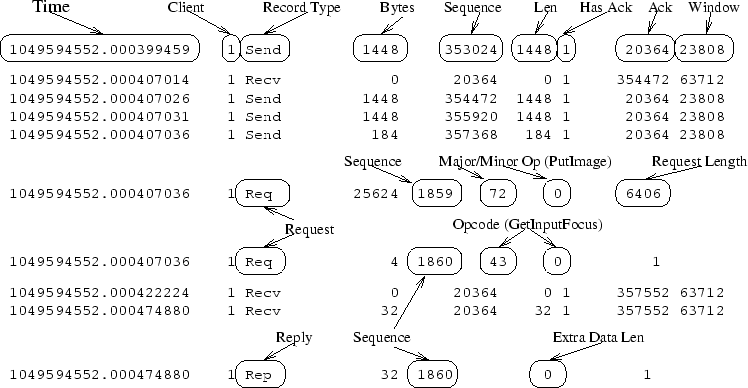
Network Data CaptureTo minimize the impact of disk activity on the network monitoring process, the packet capture tool provides minimal information about each network event that is seen in the protocol trace. Each trace record is timestamped with that captured by the kernel packet logging facility which provides kernel-level timestamping accurate to well under a millisecond. The capture application is run at nice -20 which has proven sufficient to avoid packet loss. A low level trace of the raw IP packets is logged and includes the sequence numbers, window size and packet length. This data is used to deduce the raw network state and determine whether the network is busy or whether one or both ends of the connection are compute bound. Above that, a trace of the exchanged X messages is logged. Each message is timestamped with the packet time containing the end of the message along with the X sequence number and length. Requests include the request id, events and errors include the appropriate code. If no data packets are lost in the monitoring stream, the X protocol can be completely reconstructed by the capture application. A sample of the raw data file can be seen in Figure 2. The data are logged in this minimal form to disk and the analysis is performed off-line. This raw logging serves both to reduce computational load during capture as well as to preserve the traces for multiple analysis mechanisms and regression testing of the analysis programs themselves.
Simulating Network ConditionsThe NISTNet package [Gro00] converts a Linux machine into a network emulator capable of simulating a wide variety of network conditions. NIST Net is designed to emulate end-to-end performance characteristics imposed by various wide area network topologies, such as restricted bandwidth, increased latency or even packet loss. While this package provides the ability to model inconsistent networks, we chose to simplify the data analysis in this work by modeling networks with constant bandwidth and latency. For the 100Mb test, NISTNet was disabled and the middle machine configured to act as a simple router.
Network Performance AnalysisWith data captured to disk files, a pair of tools were used to visualize the data and compute quantitative performance results from them.
Application and Network StatesTo examine the application and network behavior with a greater level of detail, a simple model of the operation of the application and the X server was developed. In each direction, the network can be in one of a few states:
Idle periods are separated from congested periods by noticing when acknowledgement packets immediately elicit additional data from the transmitter. The assumption is that the transmitter was blocked since the delivery of the preceding data packet. When the transmit window is closed, the assumption is that the receiver is blocked for some reason, rather than the network. When running X through a proxy, the receiver is the proxy application which is blocked when the low speed link is congested, so the distinction between the two congested states on the low speed link cannot be determined by examining packets captured from the high speed link. In addition, the time applications spend waiting for the X server to produce a reply is measured by checking requests which have replies and which are delivered just before a reply is received. The sum of the time spent waiting for transmission and replies is referred to as the Total Network Delay. This is a slight overestimate as time spent waiting for replies can also include a portion of the time spent waiting for transmission space.
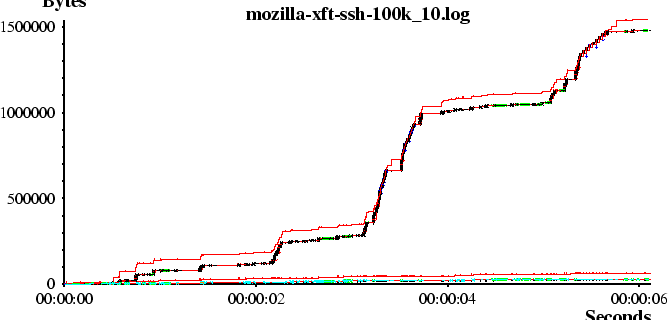
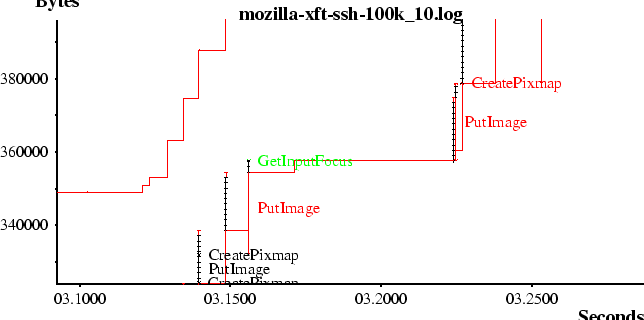
Network VisualizationA raw packet trace is difficult to analyze manually; it consists of simply a stream of numbers, and the most important data is contained only in the differences between them. In his 1990 master thesis, Tim Shepard describes the xplot network performance visualization tool [She90]. We renamed this tool `netplot' in our environment because of conflicts with another application named `xplot', it is otherwise unchanged from the xplot source code. Even the immediate glace at the resulting netplot is useful, as seen in Figure 3. If the X server is always faster than the client (the case over any network studied here), an ideal application would never be latency bound and would have a constant slope. No real application, of course, is ideal. Any approximately horizontal region of a plot is either the application unable to provide data because it is busy for some other, non window system related reason, or, the application is waiting on requests from the X server. The user can then quickly zoom in on these areas to determine the reasons for ``less than ideal'' behavior. The slope of regions of the graph which are network limited can be used to determine the actual effective bandwidth.More detail from the netplot tool can be seen by inspecting closer detail of the time and sequence number plot of a network as seen in Figure 4. As in the original xplot paper, each packet is drawn as a line with horizontal bars at either end. The length of the line indicates the packet payload length and the horizontal position indicates the time (in hours, minutes and seconds) that the packet was received by the monitoring host. The acknowledged data and available window are drawn by connected sequences of horizontal and vertical segments surrounding the packets themselves.In addition to the original presentation of the raw network performance, each packet is broken down into X messages drawn with lines and arrow heads and marked with the name of the X request, error or event. These are shown at the time of the packet containing the end of the message. When operated interactively, the state of the connection is marked in the color of the lines and arrowheads. These markings serve both to highlight areas with possible performance issues as well as to verify that the categorization algorithm is operating as expected.
Quantitative Network Performance Analysis
A separate tool, xcapanalyse, produces quantitative data about
the performance of the connection which is summarized by a small table
including one row for the request stream and another for the response.
An example from the kedit test can be seen in Table 1.
In this table, there are three separate X clients running simultaneously;
kedit launches two KDE helper applications when run on an otherwise idle X
server. The network state for each connection is split into two
values for each direction (Idle or Blocked). Time spent
awaiting replies is also displayed.
ResultsUsing the data captured from the test applications, some hypotheses were prepared and tested using the tools described above.
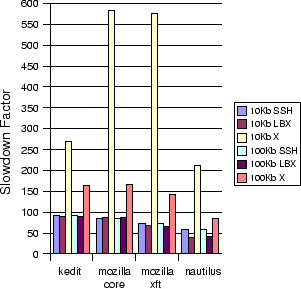
An LBX PostmortemThe LBX design was done with the knowledge that latency was a significant problem in running X applications. A lot of effort was put into finding ways to ameliorate latency in applications by 'short-circuiting' requests wherever possible. However, the architecture was circumscribed by requirements that it operate as a proxy and that no changes in applications were permitted. LBX only eliminates round trips for replies with unchanging data, such as QueryExtension, InternAtom and GetAtomName. Figure 5 shows the effect of LBX and SSH on a variety of applications over a network with 100ms latency. The values displayed represent performance relative to a 10Mb ethernet link in terms of total network delay; kedit experiences slightly more than 250 times as much network delay over a 10Kb/100ms link than it does over a 10Mb/0.1ms link. This chart demonstrates that LBX does not perform any better in these environments than SSH. The 100ms latency tests yielded the best LBX results of all. At lower latency values, LBX performed worse than SSH for all applications.
LBX latency mitigation techniques are limited to color allocation, atom management and the QueryExtension request. Of these, only the atom requests see any significant use in modern environments. QueryExtension is called only once per extension. None of the tested applications made any color allocation requests, they compute pixel values on the client side when using a TrueColor visual. TrueColor visuals are now used in the vast majority of X environments, including handheld devices. LBX also compresses the protocol through a combination of re-encoding to reduce the raw request bytecount and bytestream compression. The protocol-specific compression techniques appear to be an entirely wasted effort when followed by a general purpose bytestream compressor; SSH performs only the latter and apparently suffers no performance problem as a result. The test applications do still use atoms, and an LBX proxy shared by many similar applications would usefully cache these values on one side of the network. However, Qt applications demonstrate how to fix this by pre-interning atoms used within each application at startup time.
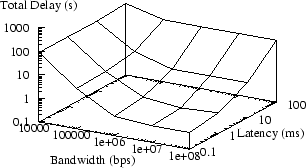
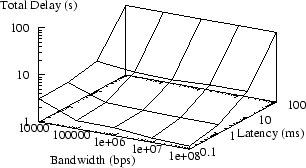
Latency Dominates BandwidthGiven the authors past experience while designing X and LBX, the effect of latency was expected to dominate that of bandwidth. Aside from image transport, X is a very compact network protocol. Nautilus running without a proxy (raw X) is shown in Figure 6. The same application running through an SSH proxy is shown in Figure 7 (the graph for LBX is essentially identical). The proxy dramatically improves application performance over low bandwidth links (10Kbps), but is ineffective at countering the effects of increased latency. The other tested applications produced essentially identical results.
Network bandwidth and latency both affect X application performance. The question is how they relate. For HTTP or FTP transfers, network latency has little or no effect on performance as TCP is designed to mitigate against latency by increasing window sizes as needed. Interactive protocols like SNMP, POP3 or X cannot mask latency in the same way as responses are computed from requests. X11 was designed to reduce the effect of latency as seen by X10 applications in a few ways - resource allocation was moved from the X server to the X client which resulted in a huge improvement in application startup performance. However, Xlib still exposes many synchronous APIs which pause application execution to wait for a reply. Looking at the raw request traffic from Nautilus shows that while starting up, it waits for 132 replies as seen in Table 2. Minor changes in the application could eliminate a significant number of these.
Compressing the X protocol with a general purpose algorithm solves the network effects due to bandwidth down to a 10Kb link. Application changes to reduce the number of synchronous requests can eliminate much of the dependency on latency.
Using AtomsGtk+ applications spend considerable time getting atom values from the server, as shown above in Table 2 Nautilus makes 46 separate synchronous calls for atom values. Qt demonstrates that by pre-caching expected atoms, the number of synchronous requests can be dramatically reduced. Kedit makes 104 requests for atom values and yet waits only 6 times.
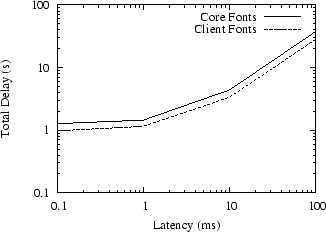
Client-side Font PerformanceThe most radical recent shift in the X Window System has been the migration of font support from the X server to the application. The Render extension provides only glyph storage and rendering functionality; all font access and glyph rasterization is done by the client. While there are many good architectural reasons for this shift [Get02], it represents a major change in how text operations appear on the network. Two otherwise almost identical versions of Mozilla were installed and configured, one using the core server-side font APIs and the other using client-side fonts. Figure 8 shows total network delays for a range of network latencies at a fixed 1Mb bandwidth for core fonts and client fonts. The client-side version is consistently faster than the core version.
The core-font version fetched 64KB of font data from the server while the client-font version sent 62KB of glyph data to the X server. Early estimates during Render design discussions about the glyph images sent by client side fonts balancing the glyph metrics received from server side fonts are borne out by this example. More significantly for low performance networks, the server-side font version required 40 additional round trips to list fonts and retrieve font metrics from the server which resulted in the savings measured above. Client side fonts have now removed one of the largest latency offenders, reducing total network delays by roughly 25% during application startup.
Improving X PerformanceWhile the main subject of this research was to produce a methodology for measuring X network performance and answering general questions about what application and protocol features affect performance, the data collected also highlight some performance issues for each of the applications run. The results in the previous section point to where efforts should be focused in attempts to improve X performance. These possible changes include:
Reducing network delays due to latency can only be effectively done by changing applications. Many of the changes needed can be done inside the toolkits which will provide benefit to many applications. Other changes would benefit from changes in underlying libraries to make latency hiding easier. Finally, while latency is the largest issue in performance over slow networks, it is interesting to consider whether bandwidth reductions through compression could be usefully applied in higher performance environments.
X and ToolkitsX11 was designed to support application development based on toolkits which provide a user interface abstraction on top of the basic window system. There have been three generations of X toolkits:
Because toolkits now hide the underlying window system almost completely, it should be possible to eliminate almost all gratuitous latency dependencies by modifying that code.
Xlib ImprovementsXlib itself, while it has served well, has become very long in the tooth. A redesigned, latency hiding library such as XCB [MS01] is one solution. Other obvious additions to Xlib can and should be implemented in short order, for example, a call back based XGetProperties interface would enable toolkits to hide much of the latency when communicating with other clients. The Metacity window manager found this technique valuable, and it is planned for the GTK+ toolkit, to mitigate problems in drag and drop as well as startup time. As this is very common and involves Xlib internal interfaces, this should be added to Xlib for general use. One of the design ``mistakes'' of X11 exacerbated by its very success is the extensible type system called atoms (as in the Lisp systems from which it was derived). This has been heavily used in the interclient communications protocols used between applications (primarily toolkits) and window managers. The InternAtom function requires a round trip to provide agreement among clients on a small (32 bit) handle for a string. A modern design would almost certainly avoid round trips entirely by using cryptographic hashes (or just using strings everywhere). Unfortunately, it is very hard to retrofit this, as atom values are so small that collisions on common hash functions would be common enough to be worrisome. Toolkits and applications, however, generally know the names of all atoms they use and this can be (sometimes with some pain rewriting code) reduced to a single round trip hiding most or all of the latency, transport, and context switch overhead. Alternatively, we could have an extension to return all atoms and names in one request. Further investigation is in order. X11's extension system is a minimalistic design, intended to mitigate the major problems that occurred as X10 was extended. Extension control is inadequate, having no facility to request reload of extensions and lacks any generic version mechanism. There are now about 10 extensions used by toolkits: querying for them and instantiating them has become a significant part of the startup time of applications, and becomes more so as other the latencies are reduced. One round trip is required to get the protocol op-code, and typically a second round trip to get a version number of the extension, resulting in approximately 20 round trips. Ironically, implementing an extensions extension may well prove the best solution, both recovering the latency and providing the missing extension functionality, rather than just batching multiple requests, the other obvious solution.
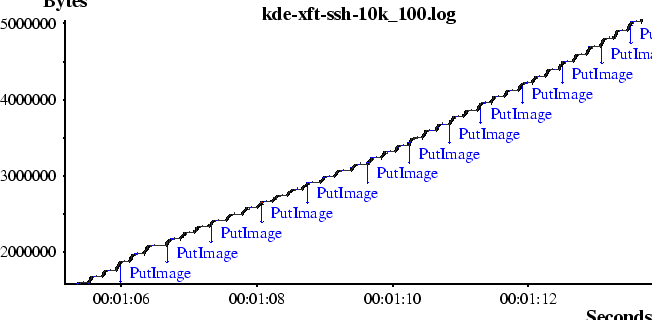
Bulk Data CompressionBandwidth is another issue worth further study. While latency may dominate application performance today, that can be solved without changes to the underlying protocol. It would be useful to investigate whether new encoding or compression techniques should be included in the protocol in the near future as such changes involve both sides of the wire and take considerably longer to deploy than changes on only one side or the other. The compression available from SSH already demonstrates some benefits for low bandwidth links. However, SSH increases latency on high speed links as it adds context switches and several manipulations of the data. Image and glyph data are often the only significant bandwidth consumers in X applications, and so they provide an easy target for specific compression operations directly within the protocol libraries. Figure 9 shows a KDE sending the desktop background through an SSH proxy. SSH bytestream compression allows the 10Kb link to transmit 3.4MB of raw X request data in 7.99 seconds, an effective bandwidth of over 3Mbit/second (!). X images are usually extremely compressible in their raw form.
But bandwidth is not only a concern when using X over a network. Modern graphics chips are usually bandwidth bound: they use all available bandwidth of the AGP bus for transmission. And the general architectural trend of the last 15 years has been that CPU cycles have increased faster than bandwidth. Additionally, keeping everything in cache has become increasingly important for best CPU performance. Keeping the protocol compact also minimizes context switches involved in data transport between applications and the X server. All these trends argue toward much closer conservation of bandwidth. There are (at least) four approaches, some of which are particularly useful in the local case, and some in the network case.
In the core protocol, GC's (graphics contexts) were used to good advantage to reduce the size of graphics requests. More recently, the Render extension was designed to avoid redundant transmission of both window and graphics state, as, arguably, the X core protocol should have been designed originally. Not transmitting redundant information is certainly better than having to compress that information. The Render extension replaces high-level geometric objects with numerous low level filled polygons (either triangles or trapezoids). An open question at this point is whether the large number of these primitive objects will have a measurable performance impact for X applications. Most X applications draw very few geometric objects (lines, circles, polygons) of any kind, but particular applications may perform very intensive graphics operations. The Render trapezoid encoding is quite general and it is likely that when tesselating shapes to trapezoids, many of the coordinates will be repeated among multiple trapezoids. A simple addition to allow requests to reuse recently transmitted information in following trapezoids may reduce the amount of data transmitted more efficiently than a general purpose compression system could. This would reduce overall memory traffic and will even be a significant benefit in the local case when trapezoid rendering is accelerated in hardware. Currently, the Render extension transmits glyphs in an uncompressed form to the server. With most applications and at the current typical screen resolution, the amount of data transmitted is roughly comparable with the use of core fonts as font metrics no longer need be transmitted. The glyphs, however, are highly compressible. Additionally, as screen resolution scales up, the size of glyphs will increase, though if compressed, the bandwidth will scale sub-linearly with resolution. Consequently, glyph compression may well be included in a future Render extension version. Similarly, a compressed image transport extension would make a significant difference for many applications (such as web browsers), as most of the data is images, and often already available in compressed form (e.g. GIF, PNG) within the client. We will need to explore the tradeoffs between CPU usage and compression efficiency further before deciding what algorithms are most appropriate, while avoiding the image processing, over-engineering and design problems that made XIE useless in practice and one of the most notable failures in attempted X extensions. Gian Filippo Pinzari [Pin03] has recently pointed out that Xlib does not zero out unused bytes in the protocol stream but transmits the left over bytes in the protocol buffer where the requests are formed. Doing so properly would not increase memory traffic given write-combining cache architectures, and may help the efficiency of general purpose compressors such as SSH. Mr. Pinzari reports significant improvements in compression ratios.
ConclusionsPerforming protocol-level performance analysis combined with passive network monitoring provides a new way to capture the effects of the network on application performance. This new data demonstrates some of the effects of recent changes in the X Window System environment and provides critical direction in improving application performance over network connections. This tool and methodology has allowed for quick understanding and quantification of performance issues.
For some interesting applications (e.g. Mozilla), a factor of 10 reduction in startup delays due to the network may be possible on broadband links through a combination of compression and latency amelioration techniques. Many of these improvements would improve performance in the local case as well. Elimination of unneeded round trips reduces context switches. Avoiding gratuitous decompression/compression stages reduces memory space and bandwidth consumption. Sharing common vertex data could reduce the amount of data sent to the graphics card. Measuring the effect of such changes in a systematic fashion will require data collection techniques than presented here, but the same kind of data analysis could be used.
Future Performance Analysis WorkThe methodology and tools described in this paper are a great aid in understanding the performance of X applications, and we believe could be very useful for other application protocols. One could build a set of tools generic to applications protocols, as the methods used would work for most protocols with some generalization. The novelty presented here of showing sequence number vs. time plots annotated with information gleaned by parsing the application protocol's requests and responses could be turned into a general, mostly table driven tool (though some protocols, such as HTTP, make this more ugly than others). The tools we built for X are an initial foray into the art, and could clearly be greatly further improved. In particular netplot could easily be extended to display the statistics of selected regions of the graph, avoiding manual tallying of areas of interest when diagnosing non-startup related performance problems. We will probably add this capability sometime soon. We have only explored a few applications, and while behavior is generally similar, there are major differences observed between toolkits. In this paper, we have primarily looked at the startup phase of applications. Performance issues come up elsewhere. For example, drag and drop implementations must interoperate and as of this writing also have performance issues. We can capture the entire application's execution, but we have not studied these other performance problems. Some work to make exploring much larger datasets might be fruitful, and tools for starting and stopping capture around interesting events would also be useful. X is generally always faster than a 100megabit/second network in the tests we performed. Exploring behavior closer to on-machine performance would be aided by tests over a gigabit/second network; note, however, that there is useful parallelism between client and server. Our previous experience indicates that sometimes two machines running X over a network end up being faster than one; whether this would still be true for X today awaits further experimentation.
AvailabilityThe tools used to capture packet traces and analyze them are all freely available under an MIT license in the author's public CVS server at https://keithp.com/cvs.html in the `xcap' and `netplot' modules. The source to this document can be found in the 'Usenix2003' module.
Bibliography
About this document ...X Window System Network PerformanceThis document was generated using the LaTeX2HTML translator Version 2K.1beta (1.48)
Copyright © 1993, 1994, 1995, 1996,
Nikos Drakos,
Computer Based Learning Unit, University of Leeds.
The command line arguments were:
The translation was initiated by Keith Packard on 2003-04-08 Keith Packard 2003-04-08
|