Mining Console Logs for Large-Scale System Problem DetectionWei Xu∗ Ling Huang† Armando Fox∗ David Patterson∗ Michael Jordan∗ |
Abstract:The console logs generated by an application contain messages that the application developers believed would be useful in debugging or monitoring the application. Despite the ubiquity and large size of these logs, they are rarely exploited in a systematic way for monitoring and debugging because they are not readily machine-parsable. In this paper, we propose a novel method for mining this rich source of information. First, we combine log parsing and text mining with source code analysis to extract structure from the console logs. Second, we extract features from the structured information in order to detect anomalous patterns in the logs using Principal Component Analysis (PCA). Finally, we use a decision tree to distill the results of PCA-based anomaly detection to a format readily understandable by domain experts (e.g. system operators) who need not be familiar with the anomaly detection algorithms. As a case study, we distill over one million lines of console logs from the Hadoop file system to a simple decision tree that a domain expert can readily understand; the process requires no operator intervention and we detect a large portion of runtime anomalies that are commonly overlooked.
Today’s large-scale Internet services run in large server clusters. A recent trend is to run these services on virtualized cloud computing environments such as Amazon’s Elastic Compute Cloud (EC2) [2]. The scale and complexity of these services makes it very difficult to design, deploy and maintain a monitoring system. In this paper, we propose to return to console logs, the natural tracing information included in almost every software system, for monitoring and problem detection.
Since the earliest days of software, developers have used free-text console logs to report internal states, trace program execution, and report runtime statistics [17]. The simplest console log generation tool is the print statement built into every programming language, while more advanced tools provide flexible formatting, better I/O performance and multiple repository support [7].
Unfortunately, although developers log a great deal of valuable information, system operators and even other developers on the same project usually ignore console logs because they can be very hard to understand. Console logs are too large [14] to examine manually, and unlike structured traces, console logs contain unstructured free text and often refer to implementation details that may be obscure to operators.
Traditional analysis methods for console log involve significant ad-hoc scripting and rule-based processing, which is sometimes called system event processing [15]. Such scripts are usually created by operators instead of developers because the problems that operators look for are often runtime-environment dependent and cannot be predetermined by developers. However, most operators do not understand the implementation details of their system well enough to write useful scripts or rules; as a result their scripts may simply search for keywords such as “error” or “critical,” which have been shown to be insufficient for effective problem determination [14].
We propose a general approach for mining console logs for detecting runtime problems in large-scale systems. Instead of asking for user input prior to the analysis (e.g., a search key), our system automatically selects the most important information from console logs and presents it to operators in a format that is a better fit to operators’ expertise. Besides extracting commonly used features such as performance traces and event counts from console logs [8, 11], we also construct console-log-specific features, such as the message count vector discussed in this paper. Although we only present one type of feature here, we are designing more features as ongoing work.
We present our methodology and techniques in the context of a concrete case study of logs from the Hadoop file system [3] running on Amazon’s EC2 [2]. The results are promising: We generate a human-friendly summary from over 1 million lines of logs, and detect commonly overlooked behavioral anomalies with very few false positives. We emphasize that although our approach is presented in a single case study, it is applicable to logs of a large variety of server systems.
Contributions. 1) We describe a novel method for runtime problem detection by mining console logs, which requires neither additional system instrumentation nor prior input from the operator. 2) We use source code analysis to help extract structured information from free text logs; source code is increasingly available for Internet services due to the heavy influence of open source software and the fact that many services develop their custom components in-house. 3) We apply principal component analysis (PCA) to detect behavior anomalies in large-scale server systems. To our knowledge this is the first time PCA has been used in this way. 4) We automatically construct decision trees to summarize detection results, helping operators to understand the detection result and interesting log patterns.
Related Work. Most existing work treats the entire log as a single sequence of repeating message types and applies time series analysis methods. Hellerstein et al. developed a novel method to mine important patterns such as message burst, message periodicity and dependencies among multiple messages from SNMP data in an enterprise network [8, 12]. Yamanishi et al. model syslog sequences as a mixture of Hidden Markov Models (HMM), in order to find messages that are likely to be related to critical failures [19]. Lim et al. analyzed a large scale enterprise telephony system log with multiple heuristic filters to find messages related to actual failures [11]. Treating a log as a single time series, however, does not perform well in large scale clusters with multiple independent processes that generate interleaved logs. The model becomes overly complex and parameters are hard to tune with interleaved logs [19]. Our analysis is based on log message groups rather than time series of individual messages. The grouping approach makes it possible to obtain useful results with simple, efficient algorithms such as PCA.
A crucial but questionable assumption in previous work is that message types can be detected accurately. [8, 12] uses manual type labels from SNMP data, which are not generally available in console logs. Most projects use simple heuristics—such as removing all numeric values and IP-address-like strings—to detect message types [19, 11]. These heuristics are not general enough. If the heuristics fail to capture some relevant variables, the resulting message types can be in the tens of thousands [11]. SLCT [17] and Sisyphus [16] use more advanced clustering and association rule algorithms to extract message types. This method works well on messages types that occur many times in log, but cannot handle rare message types, which are likely to be related to the runtime problems we are looking for in this research. In our approach, we combined log parsing with source code analysis to get accurate message type extraction, even for rarely seen message types.
There are four steps in our approach for mining console logs. We first extract structured information from console logs. By combining logs with source code, we can accurately determine message types, as well as extract variable values contained in the log. Then we construct feature vectors from the extracted information by grouping related messages. Next, we apply PCA-based anomaly detection method to analyze the extracted feature vectors, labeling each feature vector normal or abnormal. As we will describe, the threshold for abnormality can be chosen in a way that bounds the probability of false positives (under certain assumptions). Finally, in order to let system developers and operators better understand the result, we visualize the PCA detection result in a decision tree.
To make the following explanation concrete, we describe the application of our technique to the console logs generated by the Hadoop file system (HDFS) [3] while running a series of standard MapReduce jobs [1]. We use unmodified Hadoop version 0.18 (20 April 2008) running on twelve nodes of Amazon Elastic Compute Cloud (EC2) [2]: one data node, one MapReduce job tracker, and ten nodes serving as HDFS data nodes and MapReduce workers. The experiment ran for about 12 hours, during which 600GB (nonreplicated) client data were written to HDFS, 5,376 HDFS blocks were created, and 1.03 million lines of console logs were generated totaling 113MB uncompressed.
The key insight of our method is that although console logs appear to be free-form, in fact they are quite limited because they are generated entirely from a relatively small set of log output statements in the application.
A typical message in console log might look like:
10.251.111.165:50010 Served block
blk_801792886545481534 to /10.251.111.165
We can break this down into a constant pattern called the message type (Served block … to) and a variable part called the message variables (blk_801792886545481534). The message type is essential information for automatic analysis of console logs, and is widely used in prior work [17, 11].
Identifying the message type and extracting the message variables are crucial preprocessing steps for automatic analysis. Our novel technique for doing this involves examining log printing statements in source code to eliminate heuristics and guesses in message type detection step, generating a precise list of all possible message types. As a byproduct, by examining the abstract syntax tree of the source code we also get all variable values and variable names reported in log messages.
Space constraints do not permit a detailed description of the source code analysis machinery, so we summarize our results here. By automatic analysis of Hadoop source code, we extracted 911 message types; 731 are relevant to our analysis (i.e., are not simply debugging messages), and of these, 379 originate from HDFS code. We emphasize that these numbers described are all possible message types that could be generated in the log given the source code. However, in our experiment, we only find 40 distinct HDFS message types out of the 379 possible. Many of the other message types only appear in log when exceptional behavior happens, and therefore are likely to be important when they do appear. Generating message types from source code makes it possible to identify these rare cases even if they do not show up in the particular logs being analyzed. We believe this is the most significant advantage of supplementing log analysis with source code analysis rather than mining message types exclusively from the logs.
We consider console logs from all nodes as a collection of message groups. The message group can be arbitrarily constructed. The flexibility of message grouping is a direct benefit of being able to accurately extract all variable (name, value) pairs from log messages.
In a nutshell, our method uses automatically chosen log message variables as keys to group different log lines: Then for each log group, we construct a feature vector, the message count vector. This is done by an analogy to the bag of words model in information retrieval [5]. In our application, the “document” is the message group, while “term frequency” becomes message type count. Dimensions of the vector consist of (the union of) all useful message types across all groups, and the value of a dimension in the vector is the number of appearances of the corresponding message type in the group. We construct the feature from message groups because often multiple log messages together capture a single behavior of the system, and thus an anomalous pattern in the message groups is often a better indication of a particular runtime problem than an anomalous pattern among individual messages.
| 1. | Find all message variables reported in log with the following properties: |
| a. Reported many times; | |
| b. Has many distinct values; | |
| c. Appears in multiple message types. | |
| 2. | Group messages by values of the variables chosen above. |
| 3. | For each message group, create a message count vector y = [y1, y2, … ,yn], where yi is the number of |
| appearances of messages of type i (i=1 … n)in the message group. |
Algorithm 1 gives a high-level description of our feature construction algorithm, which involves three steps. In the first step, we want to automatically choose variables as keys to group messages (one key for each group). We find variables that are frequently reported by different message types and can have a large number of distinct values. This step eliminates the need for a user to manually choose grouping criteria. The intuition is that if a variable has many distinct values reported, and each distinct value appears multiple times, it is likely to be an identifier for an object of interest, such as a transaction ID, session ID, source/destination IP address, and so on. In our experiments, we have found that this criterion results in very few false selections for Internet service systems, which can be easily eliminated by a human operator. In the HDFS log, the only variable selected in step 1 is block ID, an important identifier.
In the second step, log entries are grouped by the identifier values, generating message groups we believe to be a good indicator of problems. In fact, the result reveals the life cycle of an identifier passing through multiple processing steps. The idea is very similar to execution path tracing [6], with two major differences. First, not every processing step is necessarily represented in the console logs; but since the logging points are hand chosen by developers, it is reasonable to assume that logged steps should be important for diagnosis. Second, correct ordering of messages is not guaranteed across multiple nodes, due to unsynchronized clocks. We did not find this to be a problem for identifying many kinds of anomalies, but it might be a problem for debugging synchronization related issues using our technique.
In the third step, we create a vector representation of message groups by counting the number of message types in each group, using the well established bag of words model in information retrieval [5]. This model fits our needs because: 1) it does not require ordering among terms (message types), and 2) documents with unusual terms are given more weight in document ranking, and in our case the rare log messages are indeed likely to be more important.
In practice, our feature extraction algorithm parallelizes easily into a map-reduce computation, making it readily scalable to very large log files. After source code analysis, which needs to be done only once, message type detection and feature vector generation can be done in a single pass in map-reduce.
We gather all the message count vectors to construct message count matrix Y as a m × n matrix where each row is a message count vector y, as described in step 3 of Algorithm 1. Y has n columns, corresponding to n message types (in the entire log) that reported the identifier chosen in step 1 (analogous to terms). Y has m rows, each of which corresponds to a message group (analogous to documents). From our Hadoop data set, we extracted 5,376 message count vectors y, each of which has 21 dimensions, indicating that block IDs (the only message variable selected in Step 1 of Algorithm 1) were reported in 21 message types in the entire log. Thus, we get a 5,376 × 21 message count matrix Y. We use Y for anomaly detection algorithm.
In this section we show how to adapt Principal Component Analysis (PCA)-based fault detection from multivariate process control [4] to detect runtime anomalies in logs via the message count matrix Y. Intuitively, we use PCA to determine the dominant components in message count vectors, i.e. the “normal” pattern in a log message group. By separating out these normal components, we can make abnormal message patterns easier to detect. PCA is efficient: With a small constant dimension for each vector, its runtime is linear in the number of vectors, so detection can scale to large logs.
PCA. PCA is a coordinate transformation method that maps a given set of data points onto principal components ordered by the amount of data variance that they capture. When we apply PCA to Y, treating each row y as a point in ℝn, the set of n principal components, {vi}i=1n, are defined as
| vi = arg |
| ||( Y − |
| YvjvjT) x||. |
In fact, vi’s are the n eigenvectors of the estimated covariance matrix A := 1/mYT Y, and each ∥Yvi∥ is proportional to the variance of the data measured along vi.
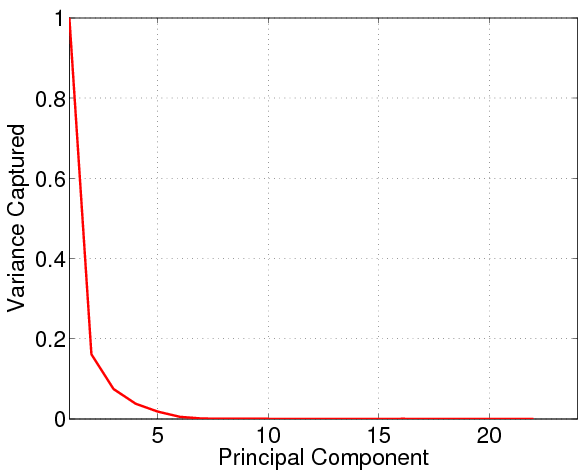
Intrinsic Dimensionality of Data. By examining the amount of variance captured by each principal component, we can use PCA to explore the intrinsic dimensionality of a set of data points. If we find that only the variance along the first k dimensions is non-negligible, we can conclude that the point set represented by Y effectively resides in an k-dimensional subspace of ℝn.
Indeed, we do observe low effective dimensionality in our message count matrix Y. In Fig. 1, we plot the fraction of total variance captured by each principal component of Y. This plot reveals that even though message count vectors have 21 dimensions, a significant fraction of the variance can be well captured by three or four principal components. The intuition behind this result is that most blocks in HDFS go through a fixed processing path, so the message groups are intrinsically determined by program logic, resulting in high correlation and thus low intrinsic dimensionality.
The normal message count vectors effectively reside in a (low) k-dimensional subspace of ℝn, which is referred to as the normal subspace Sn. The remaining (n−k) principal components constitute the abnormal subspace Sa. Intuitively, because of the low effective dimensionality of Y, by separating out the normal subspace using PCA, it becomes much easier to identify anomalies in the remaining (abnormal) subspace [4, 10]. This forms the basis for the success of PCA methods.
Detecting Anomalies. Detecting program execution anomalies relies on the decomposition of each message count vector y into normal and abnormal components, y = yn + ya, such that (a) yn corresponds to the modeled normal component (the projection of y onto Sn), and (b) ya corresponds to the residual component (the projection of y onto Sa). Mathematically, we have:
| yn = PPT y = Cn y, ya = ( I − PPT) y = Ca y, |
where P =[v1, v2, …, vk], is formed by the first k principal components which capture the dominant variance in the data. The matrix Cn = PPT represents the linear operator that performs projection onto the normal subspace Sn, and operator Ca=I−Cn projects data onto the abnormal subspace Sa.
An abnormal message count vector y typically results in a large change to ya; thus, a useful metric for detecting abnormal traffic patterns is the squared prediction error SPE ≡ ||ya||2 = || Ca y ||2. Formally, we mark a message count vector as abnormal if
|
where Qα denotes the threshold statistic for the SPE residual function at the (1−α) confidence level. Such a statistical test for the SPE residual function, known as the Q-statistic [9], can be computed as a function Qα= Qα(λk+1, …, λn), of the (n−k) non-principal eigenvalues of the covariance matrix A. With the computed Qα, this statistical test can guarantee that the false alarm probability is no more than α if the original data Y has a multivariate Gaussian distribution. However, Jensen and Solomon point out that the Q-statistic changes little even when the underlying distribution of the data differ substantially from Gaussian [9]. With our data, which may deviate from Gaussian distribution, we do find that the Q-statistic still gives excellent results in practice.
We first discuss the PCA detection results by comparing them to manual labels. Then we discuss our method of distilling the results into a decision tree which allows a domain expert unfamiliar with PCA to understand the results.
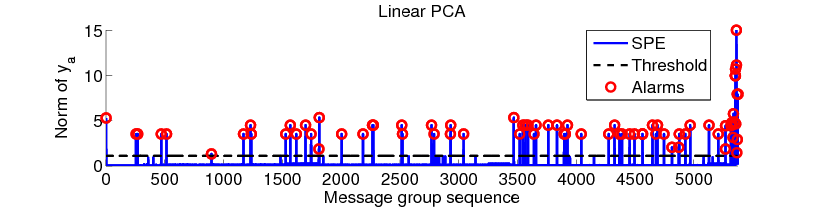
Figure 2: Detection with residual component ya, the projection on the abnormal subspace. The dashed line shows the threshold Qα. The solid line with spikes is the SPE calculated according to Eq. (1). The circles denote the anomalous message count vectors detected by our method, whose SPE values exceed threshold Qα.
Table 1: Detection Precision
Anomalous Event Events Detected Empty packet 1 1 Failed at the beginning, no block written 20 20 WriteBlock received java.io.IOException 39 38 After delete, namenode not updated 3 3 Written block belongs to no file 3 3 PendingReplicationMonitor timed out 15 1 Redundant addStoredBlock request 12 1 Replicate then immediately delete 6 2
Table 2: False Positives
False Positive Type False Alarm Over replicating (actually due to client request) 11 Super hot block 1 Unknown reasons 2
We apply the PCA-based anomaly detection method to message count matrix Y and Fig. 2 shows the result. We set α=0.001 and chose k=4 for the normal subspace, because the top 4 principal components already capture more than 95% of the variance. From the figure, we see that after projecting the message count vectors onto the abnormal space, the count vectors with anomalous patterns clearly stand out from the rest of vectors. Even using a simple threshold (automatically determined), we can successfully separate the normal vectors from the abnormal ones.
To further validate our results, we manually labeled each distinct message vector, not only marking them normal or abnormal, but also determining the type of problems for each message vector. The labeling is done by carefully studying HDFS code and consulting with local Hadoop experts. We show in the next section that the decision tree visualization helps both ourselves and Hadoop developers understand our results and make the manual labeling process much faster. We emphasize that this labeling step was done only to validate our method—it is not a required step when using our technique.
Tables 1 and 2 show the manual labels and the detection results. Our evaluation is based on anomalies detectable from the block-level logs. Throughout the experiment, we experienced no catastrophic failures, thus most problems listed in Table 1 only affect performance. For example, when two threads try to write the same block, the write fails and restarts, causing a performance hit. From Table 1 we see that our method can detect a majority of anomalous events in all but the last three categories, confirming the effectiveness of PCA-based anomaly detection for console logs. Indeed, examining the anomalous message groups, we find that some groups are abnormal because the message counts change, rather than because they contain any single anomalous error message; these abnormalities would be missed by other techniques based on individual messages rather than message groups.
However, the PCA method almost completely missed the last three types of anomalies in Table 1, and triggered a set of false positives as shown in Table 2. In ongoing work we are exploring nonlinear variants of PCA to see whether these errors arise due to the fact that PCA is limited to capturing linear relationships in the data.
In summary, while the PCA-based detection method shows promising results, it also has inherent limitations that cause both missed detection and false alarms. We are currently investigating more sophisticated nonlinear algorithms to further improve the detection capability of our method.
From the point of view of a human operator, the high-dimensional transformation underlying PCA is a black box algorithm: it provides no intuitive explanation of the detection results and cannot be interrogated. Human operators need to manually examine anomalies to understand the root cause, and PCA itself provides little help in this regard. In this section, we augment PCA-based detection with decision trees to make the results more easily understandable and actionable by human operators.
Decision trees have been widely used for classification. Because decision tree construction works in the original coordinates of the input data, its classification decisions are easy to visualize and understand [18]. Constructing a decision tree requires a training set with class labels. In our case, we use the automtically-generated PCA detection results (normal vs. abnormal) as class labels. In contrast to the normal use of decision trees, in our case the decision tree is constructed to explain the underlying logic of the detection algorithm, rather than the nature of the dataset.
The decision tree for our dataset (Fig. 3), generated using RapidMiner [13], clearly shows that the most important message type is writeBlock # received exception. If we see this message, the block is definitely abnormal; if not, we next check whether Starting thread to transfer block # to # appears 2.5 times or less. This is related to the first false positive (over-replication) in Table 2. This anomalous case actually comes from special client requests instead of failures, which is indeed a rare case but not a problem. Visualizing this false positive helps operators notice the rare over-replicating behavior, find its root cause more efficiently and thus avoid future false alarms.
The most counterintuitive result in Fig. 3 is that the message #:Got Exception while serving # to #:# indicates a normal case. According to Apache issue tracking HADOOP-3678, this is indeed a normal behavior of Hadoop: the exception is generated by the DFS data node when a DFS client does not finish reading an entire block before it stops. These exception messages have confused many users, as indicated by multiple discussion threads on the Hadoop user mailing list about this issue since the behavior first appeared. While traditional keyword matching (i.e., search for words like Exception or Error) would have flagged these as errors, our message count method successfully eliminates this false positive. Even better, the visualization of this counterintuitive result via the decision tree can prod developers to fix this confusing logging practice.
In summary, the visualization of results with decision trees helps operators and developers notice types of abnormal behaviors, instead of individual abnormal events, which can greatly improve the efficiency of finding root causes and preventing future alarms.
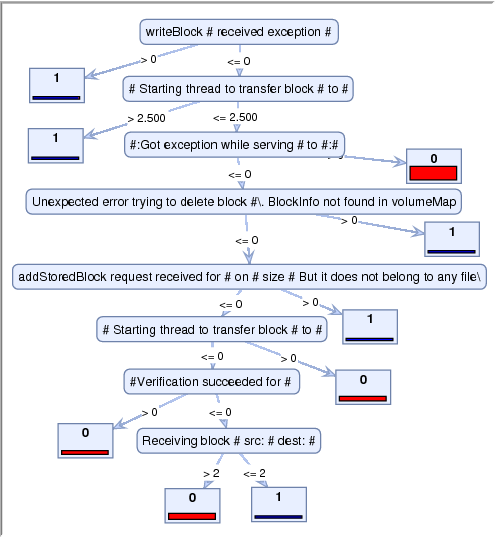
Figure 3: The decision tree visualization. Each node is the message type string (# is the place holder for variables). The number on the edge is the threshold of message count, generated by the decision tree algorithm. Small square box are the labels from PCA, with 1 for abnormal, and 0 for normal.
In this paper, we showed that we can detect different kinds of runtime anomalies from usually underutilized console logs. Using source code as a reference to understand structures of console logs, we are able to construct powerful features to capture system behaviors likely to be related to problems. Efficient algorithms such as PCA yield promising anomaly detection results. All steps in our analysis are automatically done on console logs, without any instrumentation to the system or any prior input from operators. In addition, we summarize detection results with decision tree visualization, which help operators/developers understand the detection result quickly.
As future work, we will investigate more sophisticated anomaly detection algorithms that capture nonlinear patterns of the message count features. We are designing other features to fully utilize information in console logs. Current work is postmortem analysis, but developing an online detection algorithm is also an important future direction for us. We also want to integrate operator feedback into our algorithm to refine detection results. In summary, our initial work has opened up many new opportunities for turning built-in console logs into a powerful monitoring system for problem detection.
This document was translated from LATEX by HEVEA.