SRUTI '05 Paper
[SRUTI '05 Technical Program]


Improving Spam Detection Based on Structural Similarity
Luiz H. Gomes1, Fernando D. O. Castro,
Virgílio A. F.Almeida, Jussara M. Almeida, Rodrigo B. Almeida
Computer Science Dept.,Universidade Federal de Minas Gerais, Belo Horizonte - Brazil
{lhg,fernando, virgilio,jussara, barra}@dcc.ufmg.br
-
Luis M. A. Bettencourt
Computer and Computational Sciences, Los Alamos National Laboratory, Los Alamos - USA
lmbett@lanl.gov
We propose a new spam detection algorithm that uses structural relationships
between senders and recipients of email as the basis for spam detection.
A unifying representation of users and receivers in the
vectorial space of their contacts is constructed, that leads to a natural definition
of similarity between them.
This similarity is then used to group email senders and recipients into clusters. Historical
information about the messages sent and received by the clusters is obtained by
forwarding messages to an auxiliary spam detection algorithm and this
information is used to reclassify messages. In the framework proposed, our algorithm aims
at correcting misclassifications from an auxiliary algorithm.
A simulation is performed based on actual data collected from an SMTP server
from a large University. We show that our approach is able reduce false positives,
produced by the auxiliary classification algorithm, up to about 60%.
1 Introduction
The relentless rise in spam email traffic, now accounting for about
 of all incoming messages, up from of all incoming messages, up from  in January
2003 [14], is becoming one of the greatest threats to the
use of email as a form of communication. Spam is also increasingly at the root
of major security breaches as more viruses, worms and other malicious software makes use of
spam messages to spread throughout the Internet. in January
2003 [14], is becoming one of the greatest threats to the
use of email as a form of communication. Spam is also increasingly at the root
of major security breaches as more viruses, worms and other malicious software makes use of
spam messages to spread throughout the Internet.
A major problem in detecting spam stems from active adversarial efforts to
thwart classification. Spam senders use a multitude of techniques based on
knowledge of current algorithms, to evade detection. These techniques
range from changes in the way text is written to frequent changes in
elements, such as user names, domains, subjects, etc. Although such evasion strategies are usually
naturally understood by humans, it is hard to automatically analyze them.
A central question that remains unanswered is: what are the
identifiers of spam that are most costly to change, from the point of view of
the spammer? The limitations of attempts to recognize spam by analyzing content
are emphasized in [7]. Content-based
techniques [15,22,16] have to cope
with the constant changes in the way spammers generate their solicitations. The
structure of the target space for these solicitations tends, however, to be much
more stable since spam senders still need to reach recipients in order to be
effective. Specifically, by structure we mean the space of recipients targeted
by a spam sender, as well as the space of senders that targets a given
recipient, i.e. the contact lists of a user. The contact lists, or subsets thereof,
can then be thought of as a (dynamical) signature of spam senders and
recipients. Additionally by constructing a similarity measure in these
spaces we can track how lists evolve over time, by addition or removal of
addresses.
In this paper, we propose and evaluate an algorithm for improving spam detection that
uses structural relationships between senders and recipients as the basis for
the detection of spam messages. The algorithm works in conjunction
with another spam classifier (hereafter called auxiliary algorithm), necessary to
produce spam or legitimate mail tags on past senders and receivers, which in
turn are used to infer new ones, through structural similarity. The key idea is
that the set of distinct recipients that spammers and legitimate users send
messages to, as well as the set of distinct senders from which users
receive messages from (which, in both cases, we call contact lists), can be
used as identifiers of senders and recipients in email
traffic [19,11,12]. We show that the
application of our structural algorithms over the auxiliary
classifier's results leads to the correction of a number of misclassifications.
This paper is organized as follows: Section 2 presents the
methodology used to handle email data. Our structural algorithm is described in
Section 3. We present the characteristics of the
workload studied in section 4, as well as the classification results
obtained with our algorithm over this data set. Related work is presented in
Section 5 and conclusions and future work in
Section 6.
2 Modeling Similarity Among Email Senders and Recipients
Our proposed spam detection algorithm exploits the structural
similarities in groups of senders and recipients of email.
This section introduces a unifying modeling framework of
individual email users and a metric that captures the similarity
between them.
Our basic assumption is that, in legitimate and spam traffics, users
have a list of peers they often have contact with (i.e., they
send/receive an email to/from), as can be seen in Section 4.
In legitimate traffic, contact lists stem from social relationships.
On the other hand, the lists created by spammers
to distribute their solicitations are guided by business opportunities and,
generally, do not reflect any form of social interaction.
Contact lists certainly change over time. However,
we expect them to be much less variable than other identifiers
commonly used for spam detection, such as the presence of certain keywords in
the email content or its size and encoding. In other words, we expect
contact lists to be an effective basis for detecting spam.
We start by representing an email user as a vector in a multi-dimensional
vectorial space created out of all possible contacts. We represent email senders
and recipients separately. We then use vectorial operations (the normalized
inner product in the sender/recipient spaces)
to express the similarity among multiple senders/recipients. Finally, similarity is used
to associate users into clusters. Note that the term email user is used throughout this work to
denote any identification of an email sender/recipient (e.g., email address,
domain name, SMTP relay, etc).
Let  be the number of distinct recipients. We represent a
sender be the number of distinct recipients. We represent a
sender  as a dimensional vector, as a dimensional vector,  ,
defined in the vectorial space of email recipients.
The ,
defined in the vectorial space of email recipients.
The  -th dimension (representing recipient -th dimension (representing recipient  ) of
is defined as: ) of
is defined as:
![$\displaystyle \footnotesize\vec{s_i}[n] = \left\{ \begin{array}{ll}
1, & $ if $s_i \rightarrow r_n \\
0, & $ otherwise$\ \\
\end{array}\right.,$](img12.png) |
|
|
(1) |
where
 indicates that sender has sent at least one email to
recipient. indicates that sender has sent at least one email to
recipient.
Similarly, we define  as a as a  dimensional vector representing
recipient dimensional vector representing
recipient  , where is the number of distinct senders being
considered. The -th dimension of this vector is analogously set to , where is the number of distinct senders being
considered. The -th dimension of this vector is analogously set to  if recipient
has received at least one email from if recipient
has received at least one email from  . .
We next define the similarity between two senders and  as the cosine of the angle between their vectorial representation ( and
  ).
The cosine is a well known metric that has
been successfully employed in several application areas, including
document similarity in information retrieval systems [3,20]
and intrusion detection [21]. This similarity metric is computed as: ).
The cosine is a well known metric that has
been successfully employed in several application areas, including
document similarity in information retrieval systems [3,20]
and intrusion detection [21]. This similarity metric is computed as:
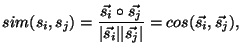 |
|
|
(2) |
where
 represents the internal product of the
vectors and represents the internal product of the
vectors and  is the norm of .
This metric varies between 0, when senders do not
share any recipient in their contact lists, and 1, when senders have identical
contact lists and thus have the same representation. The similarity between two
recipients is similarly defined. is the norm of .
This metric varies between 0, when senders do not
share any recipient in their contact lists, and 1, when senders have identical
contact lists and thus have the same representation. The similarity between two
recipients is similarly defined.
We note that our similarity metric has different interpretations
in legitimate and spam traffics. In legitimate email traffic, it represents
social relationships that consist of interactions with the same group of users, whereas in the spam
traffic, a great similarity probably represents the use of different identifiers by
the same spammer or the sharing of distribution lists by distinct spammers.
Finally, we can use our vectorial modeling approach to represent a
cluster of senders or recipients. A sender cluster  , represented
by vector , represented
by vector  , is computed as the vector sum of its elements,
that is: , is computed as the vector sum of its elements,
that is:
 |
(3) |
The similarity between a sender  and an existing cluster can be
assessed by extending Equation 2 as follows: and an existing cluster can be
assessed by extending Equation 2 as follows:
 |
|
|
(4) |
We note that the vectorial representation of a sender  and of the the sender's cluster
may change over time as new emails are considered. In order to accurately estimate the similarity
between a sender and a sender cluster to which
currently belongs to, we first remove from , and then
take the cosine between the two vectors ( and of the the sender's cluster
may change over time as new emails are considered. In order to accurately estimate the similarity
between a sender and a sender cluster to which
currently belongs to, we first remove from , and then
take the cosine between the two vectors (
 and
). This guarantees that the previous classification of a user
does not influence its new classification. Recipient clusters and
similarities are defined analogously. and
). This guarantees that the previous classification of a user
does not influence its new classification. Recipient clusters and
similarities are defined analogously.
3 Structural Similarity Algorithm
This section introduces our new email classification approach, which exploits
the similarity between email senders and recipients for their association into
clusters, which are tagged by historical information.
Our algorithms is designed to work together with any
existing spam detection or filtering technique.
Our goal is to provide a significant reduction of false positives (i.e.,
legitimate emails wrongly classified as spam), which can be as high as 15% in
current filters [2].
Figure 1:
Architecture Proposed.
|
The architecture proposed in this paper is shown in
Figure 1. A message arrives at the spam detection system and
is directed to the structural similarity algorithm. This algorithm
first sends the message to the auxiliary detection algorithm to
retrieve a first classification of that message. Based on this
classification, on the cluster formed by senders and recipients, and on
previous historical information, our algorithm generates a new classification, which
may or may not coincide with the original classification provided by the auxiliary.
The idea is to use the classification provided by the auxiliary method
to build an incremental historical knowledge base that becomes more
representative as more messages are processed.
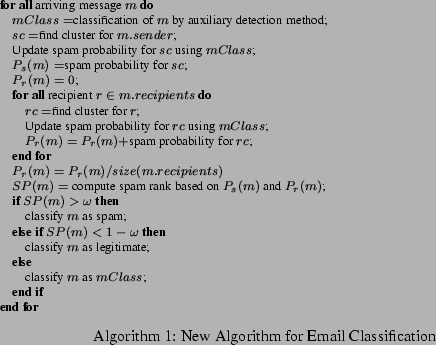
A description of the cluster-based algorithm is shown
in Algorithm 1. This algorithm maintains sets of sender and
recipient clusters, assembled from structural similarity, as defined in
Equation (4). A sender/recipient of an incoming email is added to the
sender/recipient cluster that is most similar to it, provided that their
similarity exceeds a given threshold  . Thus, defines the minimum
similarity a sender/recipient must have with a cluster to be assigned to it.
Varying allows us to create more or less tightly knit
clusters. If no similar cluster can be found, a new single-user cluster is created. . Thus, defines the minimum
similarity a sender/recipient must have with a cluster to be assigned to it.
Varying allows us to create more or less tightly knit
clusters. If no similar cluster can be found, a new single-user cluster is created.
The sets of sender and recipient clusters are updated at each new email arrival.
Recall that to determine the cluster of a previous classified user we first remove
the user from its current cluster and then assess its similarity to each existing cluster. Thus,
single-user clusters tend to be reduced as more emails are processed, except possibly
for users that appear only very sporadically.
A probability of sending/receiving spam messages is assigned to each sender/recipient
cluster. We refer to this measure as the cluster spam probability. We
calculate the spam probability of a sender/recipient cluster as the average
spam probability of its elements, which, in turn, is estimated from the
frequency of spams sent/received by each of them in the past. Therefore,
our scheme uses the result of the email classification performed
by the auxiliary algorithm on each arriving email  ( ( in
Algorithm 1) to continuously update cluster spam probabilities. in
Algorithm 1) to continuously update cluster spam probabilities.
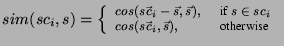
Let us define the probability of a message being sent by a spammer,
 , as the probability of its sender's cluster send a spam. Similarly, let the
probability of an email being addressed to users that receive spam, , as the probability of its sender's cluster send a spam. Similarly, let the
probability of an email being addressed to users that receive spam,
 , as the average spam probability of all of its recipients'
clusters. Our algorithm uses and to compute a
number that expresses the chance of email being spam. We call this number
the spam rank of email , denoted by , as the average spam probability of all of its recipients'
clusters. Our algorithm uses and to compute a
number that expresses the chance of email being spam. We call this number
the spam rank of email , denoted by  .
The idea is that emails with large values of and should have
large spam ranks and thus should be classified as spam messages. Similarly, emails with
small values of and should receive low spam rank and be
classified as legitimate email. .
The idea is that emails with large values of and should have
large spam ranks and thus should be classified as spam messages. Similarly, emails with
small values of and should receive low spam rank and be
classified as legitimate email.
Figure 2:
Spam Rank Computation and Email Classification for the Cluster-based
Algorithm.
|
Figure 2 shows a graphical representation of the computation
of the spam rank for a message. We first normalize the probabilities
and by a factor of  , so that the diagonal of the square
region defined in the bi-dimensional space is equal to 1 (see
Figure 2-left). Each email is represented as a point
in this square. The spam rank of , , is then defined as the length of
the segment starting at the origin (0,0) and ending at the projection of
on the diagonal of the square (see Figure 2-right). With these definitions the spam rank varies between 0 and 1. , so that the diagonal of the square
region defined in the bi-dimensional space is equal to 1 (see
Figure 2-left). Each email is represented as a point
in this square. The spam rank of , , is then defined as the length of
the segment starting at the origin (0,0) and ending at the projection of
on the diagonal of the square (see Figure 2-right). With these definitions the spam rank varies between 0 and 1.
The spam rank is then used to classify as follows: if it is greater
than a given threshold  , e.g. , e.g.
 , the email is classified as spam; if it is
smaller than , the email is classified as spam; if it is
smaller than  , it is classified as legitimate email. Otherwise, we can
not precisely classify the message, and we rely on the initial classification
provided by the auxiliary algorithm. The parameter can be tuned
to determine the precision of our classification.
Graphically, emails are classified according to the marked regions shown in
Figure 2-left. The two identical triangles represent the
regions where our algorithm is able to classify
emails as either spam (upper right) or legitimate email (lower left). , it is classified as legitimate email. Otherwise, we can
not precisely classify the message, and we rely on the initial classification
provided by the auxiliary algorithm. The parameter can be tuned
to determine the precision of our classification.
Graphically, emails are classified according to the marked regions shown in
Figure 2-left. The two identical triangles represent the
regions where our algorithm is able to classify
emails as either spam (upper right) or legitimate email (lower left).
4 Experimental Results
In this section we describe our experimental results.
We first present the most relevant details of our workload,
followed by the quantitative results of our approach.
4.1 Workload
Our email workload consists of anonymized and sanitized SMTP logs of incoming
emails to a large university in Brazil, with around 22,000 students. The
server handles all emails coming from domains
outside the university, sent to students, faculty and staff with
email addresses under the university's domain name Only the
emails addressed to two out of over 100 university subdomains (i.e.,
departments, research labs, research groups) do not pass through the central
server..
The central email server runs Exim email software [10],
the AMaViS virus scanner [1] and the Trendmicro
Vscan anti-virus tool [17]. A set of pre-acceptance
spam filters (e.g. black lists, DNS reversal) blocks about 50% of the total traffic
received by the server.
The messages not rejected by the pre-acceptance tests are directed to
Spam-Assassin [16]. Spam-Assassin is a popular spam filtering
software that detects spam messages based on a changing set of user-defined
rules. These rules assign scores to each email received, based on the presence
in the subject or in the email body of one or more pre-categorized
keywords. Spam-Assassin also uses other rules based on message size
and encoding. Highly ranked messages according to these criteria are flagged
as spam.
We analyze a log collected from 01/02/2004 to 01/10/2004.
Our logs store the header of each email (i.e. containing sender, recipients, size , date, etc.)
that passes the pre-acceptance filters, along with the results of the tests performed by
Spam-Assassin and the virus scanners. We also have the full body of the messages
that were classified as spam by Spam-Assassin. Table 1 summarizes our
workload.
Table 1:
Summary of the Workload
|
Measure |
Non-Spam |
Spam |
Aggregate |
|
# of emails |
168,352 |
153,494 |
321,846 |
|
Size of emails |
7.5 GB |
0.8 GB |
8.3 GB |
|
# of distinct senders |
12,738 |
15,325 |
22,809 |
|
# of distinct recipients |
23,849 |
25,383 |
34,065 |
|
By visually inspecting the list of sender user names
2
in the spam component of our workload, we
found that a large number of them corresponded to a random sequence
of characters, suggesting that spammers tend to change user names as an evasion
technique. Therefore, for the experiments presented below we identified the
sender of a message by his/her domain3
while recipients were identified by their full address.
Figure 3:
Number of Email User Clusters and Beta CV vs. .
|
The results shown in this section were obtained through the simulation of
the algorithm proposed in this paper over the set of messages in our logs. The
implementation of the simulator makes use of an inverted list [20]
approach for storing information about senders, recipients and clusters that is
effective both in terms of memory and processing time.
The classification rate of the simulations were both higher than the
peak rate observed over the workload collection time [12].
The number and quality of the clusters generated through our similarity
measure are the direct result of the chosen value for the threshold (see
Section 3). In order to determine the best parameter value
the simulation was executed several times for varying .
Figure 3 shows how the beta CV (Coefficient of Variation)
for the clusters and the number of clusters vs. . Beta CV denotes the intra
CV/inter CV for the clusters. Whereas the intra CV measures the coefficient of variation for
the similarities intra-cluster, the inter CV measure the similarities between
different clusters. Thus, beta CV is a measure of the quality of the clusters generated.
The more stable the beta CV the better quality in
terms of the grouping obtained [13]. There is one clear point of
stability in the curve at  (Figure 3(a)).
Moreover, the number of clusters generated also stabilize at
(Figure 3(b)). This is the value we adopt for the
remaining of the paper. Although other values of , above (Figure 3(a)).
Moreover, the number of clusters generated also stabilize at
(Figure 3(b)). This is the value we adopt for the
remaining of the paper. Although other values of , above  would also
be appropriate, the value of results in a large number of non
unitary clusters, allowing us to evaluate the benefits of the clustering
of senders and recipients. would also
be appropriate, the value of results in a large number of non
unitary clusters, allowing us to evaluate the benefits of the clustering
of senders and recipients.
Our approach is motivated by two hypothesis. First, contact lists of email
users provide an effective means for identifying them. Second, messages can be
more accurately classified as spam or not based on the probabilities of sending/receiving
spams of the cluster that their sender/recipients belong to.
Figure 4:
Spam Senders Identification Stabilization
[Mean Cosine] ![\includegraphics[width=110pt]{plots/cosStabilization.eps}](img45.png)
[CV of Cosine] ![\includegraphics[width=110pt]{plots/cvStabilization.eps}](img46.png)
|
In order to show that contact lists provide an effective user identification,
we analyze how sender/recipient vectorial representations change over time,
as new messages arrive in the system. In this analysis, we consider a warm-up
period containing a certain fraction of the messages, during which
sender/recipients are updated. We define  as the vectorial
representation of sender as the vectorial
representation of sender  at a point in time when it had sent at a point in time when it had sent
 of its own messages ( is larger than the warm-up period).
We use the similarity between the representations of sender in
two points in time, spaced by a certain fraction of its own messages ( is larger than the warm-up period).
We use the similarity between the representations of sender in
two points in time, spaced by a certain fraction  of
messages sent, as a measure of how stable the sender identification
is over ``period" . We then analyze how this similarity, given by of
messages sent, as a measure of how stable the sender identification
is over ``period" . We then analyze how this similarity, given by
 evolves as the step increases.
Figure 4(a) shows average similarity measures for the
senders in the spam traffic, varying the step from evolves as the step increases.
Figure 4(a) shows average similarity measures for the
senders in the spam traffic, varying the step from  to to  ,
for different warm-up periods. Figure 4(b) shows the
corresponding measures of coefficient of variation (CV). Note that, as
expected, when there is no warm-up period (``No Warming"), fluctuations
in the early messages dominate and stabilization is not reached by the
end of our workload. In other words, a larger set of messages
would be required for stabilization to be reached. As the warm-up period
increases, stabilization is reached with a smaller number of messages.
In particular, when we consider only the last 25% of the messages for
each sender (``Warming of 75%"), sender representation remains,
on average, very stable with CV approaching zero. Similar patterns were
observed for legitimate e-mail senders as well as legitimate and spam recipients. ,
for different warm-up periods. Figure 4(b) shows the
corresponding measures of coefficient of variation (CV). Note that, as
expected, when there is no warm-up period (``No Warming"), fluctuations
in the early messages dominate and stabilization is not reached by the
end of our workload. In other words, a larger set of messages
would be required for stabilization to be reached. As the warm-up period
increases, stabilization is reached with a smaller number of messages.
In particular, when we consider only the last 25% of the messages for
each sender (``Warming of 75%"), sender representation remains,
on average, very stable with CV approaching zero. Similar patterns were
observed for legitimate e-mail senders as well as legitimate and spam recipients.
Figure 5:
Number of Spam Messages by Varying Message Spam Probabilities for
Different Bin Sizes.
[Bin size = 0.10] ![\includegraphics[width=110pt]{plots/spamSurface_0.10_0.5.eps}](img54.png)
[Bin size = 0.25] ![\includegraphics[width=110pt]{plots/spamSurface_0.25_0.5.eps}](img55.png)
|
Next, we investigate whether the second hypothesis hold.
We plot, in figure 5, the fraction of spam
messages in our workload for different values of and
grouped based on a discretization of the full space represented in the
plot. This space is subdivided into smaller squares of the same size called
bins, the darker the gray scale the greater the number of
spams in each bin. Clearly, spam and legitimate messages are located on the top-right and
bottom-left regions of the spectrum as we have hypothesized in
Section 3. There is, however, an intermediate region in the middle where we
cannot satisfactorily determine the classification. This is why it becomes necessary to vary .
One should adjust based on the level of confidence it has on the auxiliary algorithm.
Figure 5 shows that messages addressed to recipients that
have high tend to be spam more frequently than messages with the same
value of . Analogously, messages with low have higher probability
of being legitimate messages.
Figure 6:
Messages Classified in Accordance With to the Auxiliary Algorithm and the Total
Number of Messages Classified by Varying
[Legitimate] ![\includegraphics[width=110pt]{plots/omega_Ham_0.5.eps}](img56.png)
[Spam] ![\includegraphics[width=110pt]{plots/omega_Spam_0.5.eps}](img57.png)
|
Because our algorithm makes use of an auxiliary spam detection algorithm - e.g.
SpamAssassin. Therefore, we need to evaluate how frequently we maintain the
same classification as such an algorithm. Figure 6 shows the
the percentage of messages that received the same classification and the total
number of classified messages in our simulation by varying , considering
only messages classified by the auxiliary as legitimate (Figure 6(a)) and spam (Figure 6(b)). The difference between these curves is the set
of messages that were classified differently from the original classification.
Figures 6 also shows that, considering the sets of messages
originally classified as legitimate and as spam, our algorithm is capable of
classifying a larger number of messages from the former than from the latter.
Moreover, we are slightly more conservative in the classification
of legitimate emails than spams. We conjecture that both phenomena stem from the
fact that the rules used by Spam Assassin tend to favor the detection
of legitimate messages.
In another experiment, we simulated a different algorithm that also makes
use of historical information provided by an auxiliary spam detector
described in [19].
The main differences are that it uses historical information of each
sender separately and it does not use recipients information. We built
a simulator for this algorithm and executed it against our data set.
The results show that it was
able to classify  of the messages in accordance
with the auxiliary algorithm, while our approach classify more than 95% with of the messages in accordance
with the auxiliary algorithm, while our approach classify more than 95% with  . .
We believe that the differences between the original classification and the
classification proposed for high values generally are due to
misclassifications by the auxiliary algorithm. In our data set we have access to
the full body of the messages that were originally classified as spam. We
were able to evaluate a fraction of the total amount of false positives (messages that
the auxiliary algorithm classify as spam and our algorithm classify as
legitimate) that were generated by the auxiliary algorithm. This is
important since the cost of false positives is usually believed higher
than the cost of false negatives [7].
Table 2:
Possible False Positives Generated by the Approaches Studied.
|
Algorithm |
% of Misclassifications |
|
Auxiliary |
 |
|
Our approach |
 |
|
Each of the possible messages classified by the auxiliary
as spam and by our algorithm as legitimate was manually evaluated by three people, in order to
determine whether such a message was indeed spam. Table 2
summarizes the results for , 879 messages ( of the total messages)
were manually analyzed. Our algorithm was correct in more 60% of the cases. of the total messages)
were manually analyzed. Our algorithm was correct in more 60% of the cases.
Due to the cost of manually classifying messages we can not afford to classify all
of the messages categorized as spam by the auxiliary algorithm. However, we
evaluate a randomly chosen fraction of the messages classified as spam by the
auxiliary and by our algorithm, which represents the total data with a confidence
interval of 99% [18]. With , we found that  of the
total messages are in this group and we analyzed manually
a sample of of the
total messages are in this group and we analyzed manually
a sample of  (1,708 emails) of them. We found that 99.9% of the analyzed messages were
correctly classified, showing the high precision of our classification. (1,708 emails) of them. We found that 99.9% of the analyzed messages were
correctly classified, showing the high precision of our classification.
Moreover, only  of the total of messages classified as legitimate
by the auxiliary were found to be spam by our approach. Consequently,
the total number of messages correctly moved from spam class to legitimate class is 47% greater
than the number of messages moved from legitimate class to spam class by our algorithm.
Moreover, we emphasize that we can not determine the quality of the classification for the
messages classified as legitimate by the auxiliary algorithm since we do not have
access to the full body of those messages. of the total of messages classified as legitimate
by the auxiliary were found to be spam by our approach. Consequently,
the total number of messages correctly moved from spam class to legitimate class is 47% greater
than the number of messages moved from legitimate class to spam class by our algorithm.
Moreover, we emphasize that we can not determine the quality of the classification for the
messages classified as legitimate by the auxiliary algorithm since we do not have
access to the full body of those messages.
5 Related Work
Several previous studies have focused on reducing the impact of spam email traffic.
The approaches to reduce spam can be categorized into pre-acceptance and
post-acceptance methods, based on whether they detect spam before
or after accepting messages. Examples of pre-acceptance methods
are server authentication [8,4] and
accountability [6]. Post-acceptance methods are mostly based on
information available in the body of the messages and include Bayesian
filters [15] and collaborative filtering [22].
Recent papers have focused on spam combat techniques based
on characteristics of graph models of email
traffic [5,9]. In [5] a graph is
created to represent the email traffic captured in the mailbox of individual users.
The clustering coefficient of each of these components is used to
classify messages as spam or legitimate. The results show that 53% of
the messages were precisely classified using the proposed approach. In [9] the
authors propose to detect machines that behave as spam senders by analyzing
a border flow graph of sender and recipient machines. In contrast to these studies,
we propose to use a structural similarity between email senders and recipients to group
them into clusters and use the cluster historical information to
improve spam detection. Moreover, unlike [5], our approach runs on the ISP level.
None of the existing spam filtering mechanisms are
infallible [19,7]. Their main handicap are false positives and
wrong mail classification. In addition, filters must
be continuously updated to capture the multitude of mechanism constantly
introduced by spammers to avoid filtering actions. The algorithm presented in
this paper aims at improving the effectiveness of spam filtering mechanisms,
by reducing false positives and by providing information to tune their collection of rules.
6 Conclusions and Future Work
In this paper we proposed a new algorithm to improve spam detection
based on the structural similarity between contact lists
of email users. The idea is that contact lists, integrated
over a suitable amount of time, are much more stable identifiers
of email users than user names, domains
or message contents, which can all be made to vary quickly and widely.
The major drawback of our approach is that our algorithm can only group
users based on their structural
similarity, but has no way of determining by itself if such vector
clusters correspond to spam or legitimate email. Thus it must work
in tandem with an original classifier. Given this information
we have shown that we can successfully separate
spam and legitimate email users and that this structural
inference can improve the quality of other spam detection algorithms.
Specifically we have implemented a simulator based on data collected
from the main SMTP server for a major university in Brazil that uses
SpamAssassin. We have shown that our algorithm can be tuned to
produce classifications similar to those of the original
classifier algorithm and that, for a certain set of parameters,
is was capable of correcting false positives.
As future work, we intend to: (i) explore aging mechanisms to
update the vectorial identification of senders and recipients
over time, and (ii) study the robustness of our approach against
different auxiliary classifiers.
- 1
-
AMaViS - Home Page.
http://www.amavis.org.
- 2
-
ATKINS, S.
Size and Cost of the Problem.
In Proc. 56th IETF Meeting (San Francisco, California, USA,
March 2003).
- 3
-
BAEZA-YATES, R., AND RIBEIRO-NETO, B.
Modern Information Retrieval.
Addison Wesley Longman Publishing Co. Inc., 1999.
- 4
-
BAKER, H. P.
Authentication Approaches.
In Proc. 56th IETF Meeting (San Francisco, California, USA,
March 2003).
- 5
-
BOYKIN, P. O., AND ROYCHOWDHURY, V.
Leveraging Social Networks to Fight Spam.
IEEE Computer 38, 4 (April 2005), 61-68.
- 6
-
BRANDMO, H. P.
Solving Spam by Establishing a Platform for Sender
Accountability.
In Proc. 56th IETF Meeting (San Francisco, California, USA,
March 2003).
- 7
-
CERF, V. G.
Spam, Spim, and Spit.
Commun. ACM 48, 4 (2005), 39-43.
- 8
-
CRANOR, L. F., AND LAMACCHIA, B. A.
Spam!
Communications of the ACM 41-8 (August 1998), 74-83.
- 9
-
DESIKAN, P., AND SRIVASTAVA, J.
Analyzing Network Traffic to Detect E-Mail Spamming
Machines.
In Proc. ICDM Workshop on Privacy and Security Aspects of Data
Mining (Brighton UK, November 2004), pp. 67-76.
- 10
-
Exim Internet Mailer Home Page.
http://www.exim.org.
- 11
-
GOMES, L. H., ALMEIDA, R. B., BETTENCOURT, L. M. A., ALMEIDA, V. A. F.,
AND ALMEIDA, J. M.
Comparative Graph Theoretical Characterization of Networks
of Spam and Regular Email.
http://www.arxiv.org/abs/cs.CR/0504012, March 2005.
- 12
-
GOMES, L. H., CAZITA, C., ALMEIDA, J., ALMEIDA, V. A. F., AND JR., W. M.
Characterizing a Spam Traffic.
In Proc. 4th ACM SIGCOMM Conference on Internet Measurement
(Taormina, Italy, 2004), ACM Press, pp. 356-369.
- 13
-
MENASC´E, D., AND ALMEIDA, V.
Capacity Planning for Web Services: Metrics, Models
and Methods.
Prentice Hall Inc., USA, September 2001.
- 14
-
Message Labs Home Page.
http://www.messagelabs.co.uk/.
- 15
-
SAHAMI, M., DUMAIS, S., HECKERMAN, D., AND HORVITZ, E.
A Bayesian Approach to Filtering Junk E-Mail.
Tech. Rep. WS-98-05, AAAI Workshop on Learning for Text
Categorization, Madison, Wisconsin, July 1998.
- 16
-
SpamAssassin Home Page.
http://www.spamassassin.org.
- 17
-
Trend Micro Home Page.
http://www.trendmicro.com.
- 18
-
TRIVEDI, K. S.
Probability and Statistics with Reliability, Queuing,
and Computer Science Applications.
John Wiley & Sons, New York, NY, 2001.
- 19
-
TWINING, R. D., WILLIANSON, M. M., MOWBRAY, M., AND RAHMOUNI, M.
Email Prioritization: Reducing Delays on Legitimate Mail
Caused by Junk Mail.
In Proc. Usenix Annual Technical Conference (Boston, MA, June
2004), pp. 45-58.
- 20
-
WITTEN, I. H., BELL, T. C., AND MOFFAT, A.
Managing Gigabytes: Compressing and Indexing Documents
and Images.
John Wiley & Sons, Inc., New York, NY, USA, 1994.
- 21
-
XIE, Y., KIM, H., O'HALLARON, D., REITER, M., , AND ZHANG, H.
Seurat: A Pointillist Approach to Anomaly Detection.
In Proc. of the 7th International Symposium on Recent Advances
in Intrusion Detection (RAID2004) (Sophia Antipolis, French Riviera,
France, September 2004), Springer Verlag, pp. 238 - 257.
- 22
-
ZHOU, F., ZHUANG, L., ZHAO, B., HUANG, L., JOSEPH, A., AND KUBIATOWICZ,
J.
Approximate Object Location and Spam Filtering on
Peer-to-Peer Systems.
In Proc. Middleware (Rio de Janeiro, Brazil, January 2003),
pp. 1-20.
Improving Spam Detection Based on Structural Similarity
This document was generated using the
LaTeX2HTML translator Version 2K.1beta (1.48)
Copyright © 1993, 1994, 1995, 1996,
Nikos Drakos,
Computer Based Learning Unit, University of Leeds.
Copyright © 1997, 1998, 1999,
Ross Moore,
Mathematics Department, Macquarie University, Sydney.
The command line arguments were:
latex2html -split 0 -show_section_numbers -local_icons sruti.tex
The translation was initiated by Fernando Duarte Oliveira Castro on 2005-05-25
Footnotes
- ... Gomes1
- Luiz H. Gomes is supported by Banco Central do
Brasil.
- ... names2
- The part before @ in email addresses
- ... domain3
- The part after @ of an email address
Fernando Duarte Oliveira Castro
2005-05-25
|


![\includegraphics[width=160pt]{figures/archlhg.eps}](img31.png)
![\includegraphics[width=160pt]{figures/spamRank.eps}](img38.png)
![\includegraphics[width=150pt]{plots/tauxncomm.eps}](img42.png)