| ||||||||||||||||||||||||||||||||||||||||||||||||||||
|
MobiSys '05 Paper
[MobiSys '05 Technical Program]
A Relative Positioning System for Co-located Mobile DevicesMike Hazas, Christian Kray, Hans Gellersen, Henoc Agbota,
Gerd Kortuem
AbstractIf a mobile computing device knows how it is positioned and oriented in relation to other devices nearby, then it can provide enhanced support for multi-device and multi-user interactions. Existing systems that provide position information to mobile computers are reliant on externally deployed infrastructure, such as beacons or sensors in the environment. We introduce the Relate system, which provides fine-grained relative position information to co-located devices on the basis of peer-to-peer sensing, thus overcoming dependence on any external infrastructure. The system is realised as a hardware/software plug-in, using ultrasound for peer-to-peer sensing, USB to interface with standard mobile devices, and data abstraction and inferencing to map sensor data to a spatial model that maintains both quantitative and qualitative relationships. We present a set of services and applications to demonstrate the utility of the system. We report experimental results on the accuracy of the relative position and orientation estimates, and other aspects of system performance.
| ||||||||||||||||||||||||||||||
|
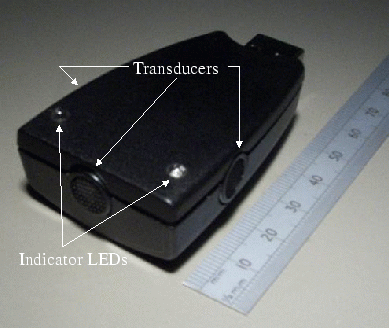
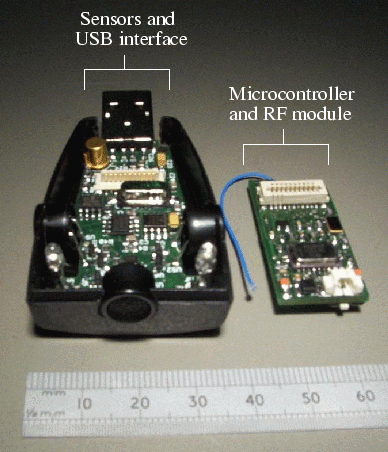
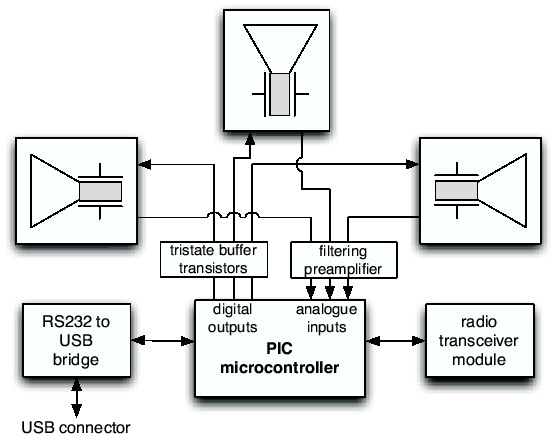
Figure 3 depicts the hardware architecture of the dongle, which is based around a PIC18F452 microcontroller. Unlike many previous systems utilising ultrasonic ranging for location sensing, the interface circuitry to the transducers in the Relate dongle is bidirectional. To emit ultrasound, the PIC's digital output pins drive the transducers through buffering transistors. To detect ultrasonic pulses, the transistor buffers are used to put the transducers into a tri-state mode, and the PIC samples the signals present on the transducer terminals.
|
The PIC is also connected to an RFM radio transceiver operating in the 868.35 MHz ISM band. The transceiver provides wireless synchronisation and communication between the dongles in the Relate network. Finally, the dongle's PIC communicates with its host via an FT232BM, which is an RS232-to-USB bridge chip. Host device drivers for the bridge are readily available for Windows, Linux, and Macintosh operating systems. Upon connection of the bridge to the USB bus of the host, the drivers create a virtual serial port which provides the interface to services and applications.
|
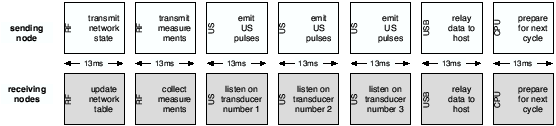
When a Relate dongle gets access to the network it utilises a number of time slots for data transmission and for ultrasonic signalling. Minimally, seven slots are used: two for RF communication, three for ultrasonic signalling, one for USB communication, and a final one for preparation of the next transmission cycle (see figure 4). The first RF packet is used for transmission of observed network state as a table of device IDs each with a timestamp of their last sighting. Receiving nodes use this table to update their own view of the network. This is followed by a packet that communicates range and angle-of-arrival measurements that have been taken since the dongle last had access to the network.The size of the network state table and the number of measurements broadcast increase with the number of dongles in the system. To be able to transmit this information fully, dongles dynamically change the number of RF slots used depending on the number of dongles present. For example, two slots are utilised by systems with up to ten dongles, whereas systems with eleven to nineteen dongles utilise three slots. Receiving dongles collect this to provide their hosts with measurements from across the network. The remaining time slots are reserved for ultrasonic sensing and USB communication with the host, described further below.
When a Relate dongle first connects to a network it interrupts the protocol cycle described above to send a time request packet. This prompts devices on the network to set a flag to use their next transmission cycle to include real-time clock information in their network state packet. By this means, all dongles are synchronised to a global ``dongle network time'' to keep track of when other dongles have last been sighted on the network. This information is required to maintain a shared and consistent understanding of how many nodes are present on the network, as the protocol adapts to network size.
The network state table is shared in a multi-hop fashion. For example, if dongle A does not have direct RF communication to dongle B, it still keeps a record of when dongle B was last seen, based on the network state packets received from the other dongles. Dongle A also broadcasts this information in its own network state packets. This multi-hop network state information is used to implement fair access, with each device backing off for the number of slots required for all other dongles to have a complete transmission cycle.
Another function of the Relate protocol is to propagate host information through the dongle network. Each dongle receives information from its host device once it becomes connected to it. This includes host name, user name and IP address. This information is sent at a certain interval (in our current implementation every five seconds) as a host information packet over the dongle network. Receiving dongles pass this information on to their hosts. Hosts store the information about one another in their model layer, and use the transmitted IP addresses to test availability of an IP connection between one another.
After a Relate dongle has obtained network access and used two time slots to transmit RF packets, the following three time slots are devoted to ultrasonic sensing. In each time slot, the transmitting device emits ultrasound from all its transducers simultaneously. The other dongles use the two RF packets as a trigger to listen for ultrasonic pulses. Because of the analogue sampling limitations of the PIC18F, the dongles can only monitor one of their transducers at a time. Therefore three consecutive 13 ms time slots are used for emission of ranging pulses, in order for the receiving dongles to gather data using all three of their transducers.
The receiving dongles use data only from transducers on which they detect ultrasonic pulses of sufficient strength, and measure the peak signal values and the times-of-flight of the ultrasonic pulses sent by the transmitting device. The smallest time-of-flight is then used to calculate a range estimate. In addition, an angle-of-arrival estimate is derived using the known orientation of transducers on the dongle and calculated based on the relative spread of peak signal values measured across these transducers.
Relate devices collect sensor data as six-tuples including the IDs of the transmitting dongle and receiving dongle, the range and angle-of-arrival estimates, the number of transducers at which a sufficiently strong pulse was detected, and a timestamp. Each dongle maintains a buffer into which it writes its own sensor observations made when another dongle emits ultrasonic pulses, as well as sensor data received from other dongles via radio.
All dongles use a dedicated time slot after ultrasonic sensing to transmit sensor data from their buffer over the USB link to their host. At any time, the content of the buffers across the dongle network will vary to an extent due to the delay between local calculation of sensor data and its propagation to other dongles in the network. As a result, the data received by hosts in the Relate network will include measurements taken by other dongles in the sensor network (and not only by the directly attached dongle). However, the data will not be absolutely consistent across hosts at any particular time, as local sensor readings are available ahead of remote ones.
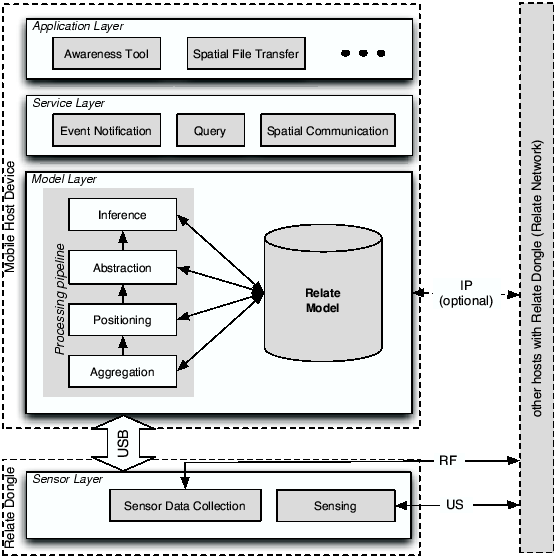
Relate hosts use the sensor data provided by the dongle network to generate and maintain a spatial model as a real-time representation of the spatial configuration of all devices in a Relate network. This involves a data processing pipeline with four consecutive stages for cyclic updates of the model.
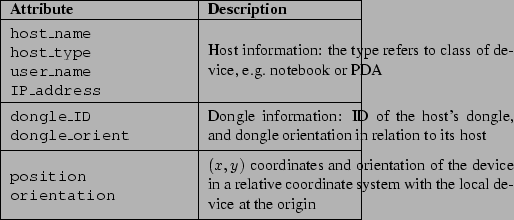
The Relate model is a list of labelled directed graphs. Each graph represents the spatial arrangement of devices in a Relate network at a particular point in time. The list represents an ordered history of spatial information, with the most recent graph in the list representing the current arrangement of devices. A graph may be incomplete as it is dependent on information provided from the sensor layer. The nodes in the graph represent devices and the edges indicate spatial relationships between devices. Both nodes and edges are labelled with attribute-value pairs to capture properties of devices and their relations. The attributes of devices are summarised in table 1.
The relationships between devices fall into three categories. First, relationships between one device and another can be derived from raw sensor data, and expressed as a six-tuple data object: transmitting and receiving dongle IDs, range, angle-of-arrival, number of receiving transducers, and time stamp. Each pair of devices can be associated with up to two measurements, as measurements are directed. Second quantitative relationships can be expressed as the distance between devices, and bearing of one device with respect to another in the local coordinate system. Third, qualitative relationships describe the relative spatial arrangement of one device with respect to another (left_of, in_front_of, right_of), and of relative movement (approaching, moving_away).
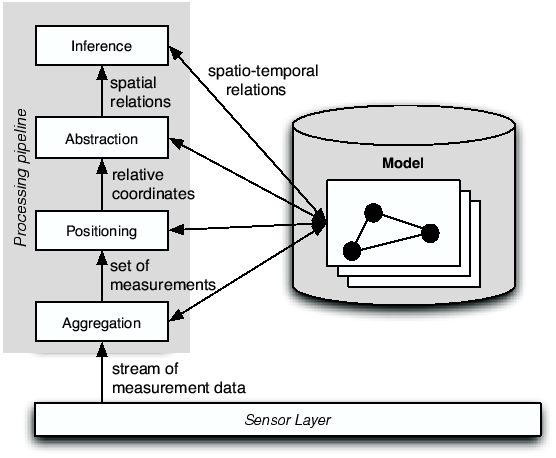
The Relate model is continuously updated by processing the stream of sensor data generated by the sensor layer below. The sensor data is processed in a staged pipeline with each stage computing certain information for the model. Each processing cycle through this pipeline results in a new graph that is indexed and timestamped, and added to the list. Previously computed graphs are maintained in the list to facilitate reasoning about spatiotemporal information such as relative device trajectories. Over time, graphs may become invalid for temporal reasoning and removed.
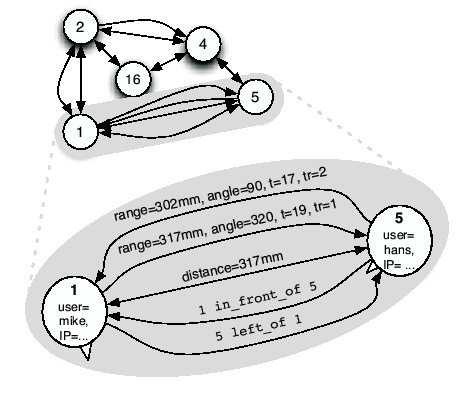
For illustration of the graph representation, an example is shown in figure 5. Hosts with dongles are represented as nodes and their relationships as a set of directed or bidirectional edges. The lower part of the figure depicts several quantitative and qualitative relations between node 5 and node 1. The two topmost edges represent measurements taken by node 1 observing node 5 and vice versa. As the example shows, range estimates can vary due to measurement error. Other relationships shown include distance as well as qualitative relations, all resulting from processing of raw sensor data.
|
The processing pipeline for the spatial model consists of four stages, with the first one operating on the data provided by the sensor layer, and the following ones each operating on the output of the previous stage. The pipeline generates and maintains the Relate model as summarised in figure 6.
The initial pipeline stage generates a new graph at the start of each processing cycle and adds it to the Relate model's list, indexed with the next increment. It continuously reads sensor data packets provided by the sensor layer from the USB interface. Each packet represents a measurement described as a six-tuple. The data it contains is extracted and added to the model in the form of new device relationships. Sensor data is aggregated for the current graph until a specified condition is met that triggers the next processing stage in the pipeline, and a new cycle for sensor data aggregation. This condition can be time-based (e.g. ``trigger every 500 ms''), data-driven (e.g. ``trigger every 100 data packets''), or a combination of both (``trigger every second or when 50 new data packets have been aggregated''). When this condition is met, then the current graph is completed with recent sensor_data objects from the previous graphs to ensure that the newly inserted graph contains a complete set of sensor measurements irrespective of the duration of an aggregation cycle or the number of newly gathered sensor data packets.
The second stage operates on the sensor_data objects in the
Relate graph to compute quantitative spatial attributes and relations,
i.e. device relative positions and orientations. The range and
angle-of-arrival measurements can be used to arrive at a solution for
the relative positions and orientations of the devices using a system
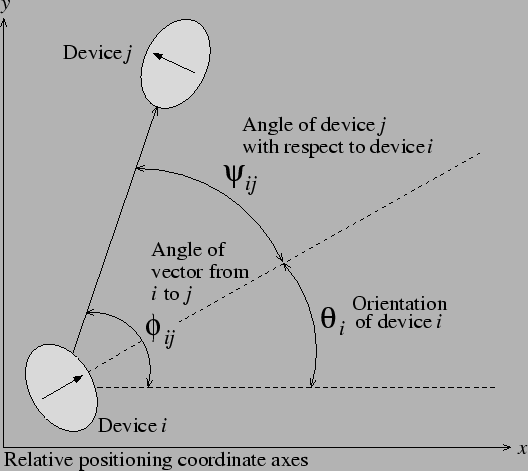
of equations. More specifically, the range ![]() between device
between device
![]() , located at
, located at ![]() , and device
, and device ![]() , located at
, located at ![]() ,
can be defined as follows:
,
can be defined as follows:
Also, the reception angle ![]() at device
at device ![]() with respect to
device
with respect to
device ![]() can be related to
can be related to ![]() , the orientation of device
, the orientation of device ![]() with respect to the the coordinate system used by the local host:
with respect to the the coordinate system used by the local host:
Since the devices in the system report measurements of the ranges
![]() and the angles-of-arrival
and the angles-of-arrival ![]() , a non-linear
regression algorithm can be applied to arrive at estimates for the
devices' 2D relative locations and orientations. The regression
process converges toward location and orientation estimates which
minimise the sum of the squares of the residuals (i.e. the
difference between devices' measured ranges and angles, and the ranges
and angles as calculated using equations 1 and
2). The solution can be further refined by using
Studentized residuals to identify ranges and angles which are
likely to have large errors, and repeating the regression with those
measurements discarded. The algorithm also creates an estimate of the
standard error of the solution set, based on the residuals of
the final data used. This error estimate is essentially a measure of
``goodness of fit,'' and can be used to discard location and
orientation solution sets which do not statistically fit the data
supplied. These techniques have previously been shown to work well in
positioning systems [27].
, a non-linear
regression algorithm can be applied to arrive at estimates for the
devices' 2D relative locations and orientations. The regression
process converges toward location and orientation estimates which
minimise the sum of the squares of the residuals (i.e. the
difference between devices' measured ranges and angles, and the ranges
and angles as calculated using equations 1 and
2). The solution can be further refined by using
Studentized residuals to identify ranges and angles which are
likely to have large errors, and repeating the regression with those
measurements discarded. The algorithm also creates an estimate of the
standard error of the solution set, based on the residuals of
the final data used. This error estimate is essentially a measure of
``goodness of fit,'' and can be used to discard location and
orientation solution sets which do not statistically fit the data
supplied. These techniques have previously been shown to work well in
positioning systems [27].
The positioning stage operates on all sensor information available in the model and produces new position and orientation data for all devices represented in the model at that point in time. Note that this data is described in relative coordinates referenced to the local host on which the model is computed.
The third stage of the pipeline performs various abstractions on the quantitative output of the previous stage in order to generate qualitative information. The relative coordinates are transformed into qualitative relations that encode spatial relationships, which are closer to human concepts of space [6]. The abstraction stage computes both angular and distal relations. The former operate on the orientation information, and compute relations such as left_of based on angular deviation from a cardinal direction. The latter are computed from the coordinates using threshold values to partition distances into categories such as nearby or far_from. The output of this stage hence consists of a set of static spatial relations, which are inserted in the model before the final stage of the pipeline is triggered.
The inference stage deals with change over time. It takes the output of the abstraction stage and compares the set of relations to those contained in previous graphs in the list. The inference process is based on first order logic and generates a set of spatiotemporal relations such as approaching or moving_away [13]. It also identifies events such as the arrival of new nodes in the Relate network or the departure of nodes. For example, a node is assumed to have moved away from the Relate network when no sensor data for the node has been registered over a certain period of time. The computation of these relations constitutes the final step in the Relate graph generation cycle. After completion of this stage, the current graph is timestamped. It remains stored in the model but gets moved further back in the list as newer graphs are added.
|
The service layer provides spatially-aware applications with access to the Relate model. Three services are available. The event service implements an asynchronous communication channel between the model and the application. It allows applications to subscribe to model updates and to receive associated event notifications. The query service provides applications with read-only access to the model. Applications can read specific attribute values associated with nodes and relations or they can get a copy of the entire model. The spatial communication service implements a spatially-aware group communication mechanism for Relate applications.
A spatial event subscription contains two arguments: a predicate and a
notification mode. Predicates are expressions of spatial situations
such as distance(device1, device2) < 1 m. They define in which
situation a notification should be sent. The notification mode
determines how often a notification needs to be sent. There are two
modes: once indicates that a notification should be sent only
the first time a predicate holds; continuous mode indicates a
notification should be sent as long as the predicate holds. For
example, to be notified when a device comes within one metre of the
local device, an application would specify the predicate distance(local, ![]() ) < 1 and notification mode once. (By
definition, local is a built-in constant referring to the local
device, and
) < 1 and notification mode once. (By
definition, local is a built-in constant referring to the local
device, and ![]() is a variable which refers to any device matching the
criterion.) To be notified repeatedly as long as there is a device in
front of the local device, the application would specify the condition
in_front_of(local,
is a variable which refers to any device matching the
criterion.) To be notified repeatedly as long as there is a device in
front of the local device, the application would specify the condition
in_front_of(local,![]() ) with mode continuous. The actual
notification frequency depends on the update rate of the model, which
in turn is determined by the availability of new sensor data.
) with mode continuous. The actual
notification frequency depends on the update rate of the model, which
in turn is determined by the availability of new sensor data.
The query service provides applications with read-only access to the model. Applications can read attribute values of individual nodes or they can get a copy of the entire model. Examples of some query methods are as follows: getDeviceList() returns list of all available devices; getDeviceCoordinates() returns coordinates of a device; and getDevicesInFront() returns devices in front of the current device.
These queries retrieve information from graphs stored in the model. There is a time parameter in each call which specifies which data should be retrieved: the most recent graph can be accessed by specifying the constant now, a positive number indicates an absolute timestamp (for example ``10h30m17s'') and a negative number indicates a relative time period (i.e. ``-30s'' refers to data that is thirty seconds old). If there is no exact match between the specified time and the timestamps of the graphs, the graph whose timestamp is closest is selected.
The communication service realises an asynchronous communication mechanism for Relate applications. It provides a number of spatially-aware communication primitives that can be used to disseminate data between Relate devices. For example, send(host_name, msg) sends a message to a single named device; sendFront(msg) sends a message to all devices currently in front of the local device; and sendBeyondDistance(float, msg) sends a message to all devices that are currently more than a specified distance away from the local device.
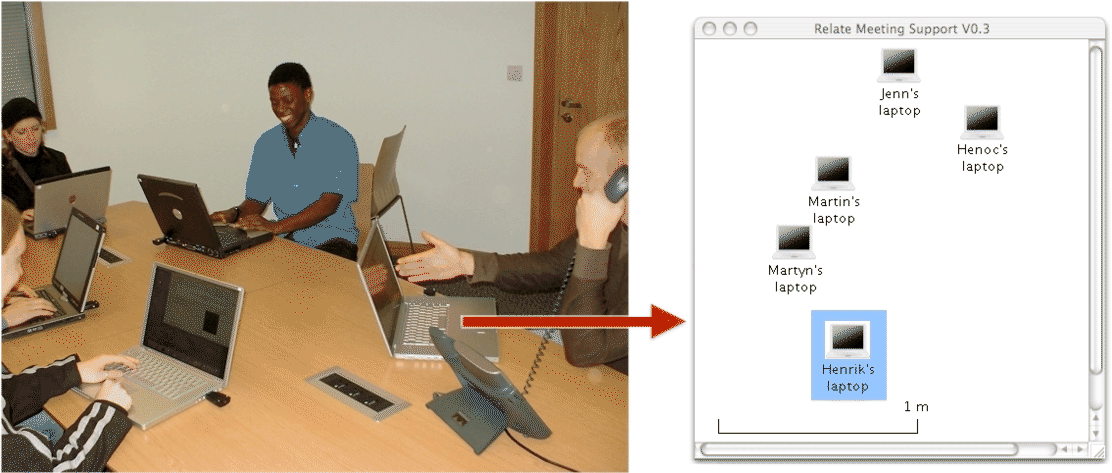
An ``awareness tool'' can be used to provide users with a visualisation of the arrangement of nearby Relate devices (figure 8). For example, the name of each device's owner or user can be displayed underneath the device. Using this view, people can easily identify each other in a meeting scenario where participants sit around a table with their computers in front of them. This is relevant in situations where participants may not know one another by name.
The awareness tool makes use of the query and event services. At
startup it requests a copy of the complete model and builds the
initial visualisation using the getDeviceList(now, ...) and getDeviceCoordinates(now, ...) query primitives. Then, it uses the
event service to stay informed about the coordinates of each device
and about newly appearing or disappearing devices. To
subscribe to the coordinates of all devices the tool uses the
following subscription: predicate coordinate(![]() ) with mode continuous. To receive a notification when a device enters or leaves
the Relate network, the tool can use the following two
subscriptions: appearing(
) with mode continuous. To receive a notification when a device enters or leaves
the Relate network, the tool can use the following two
subscriptions: appearing(![]() ) and disappearing(
) and disappearing(![]() ) (in
both cases with mode once).
) (in
both cases with mode once).
Note that the awareness tool does not require IP connectivity between devices. All information displayed is communicated over the dongle network, including the user name.
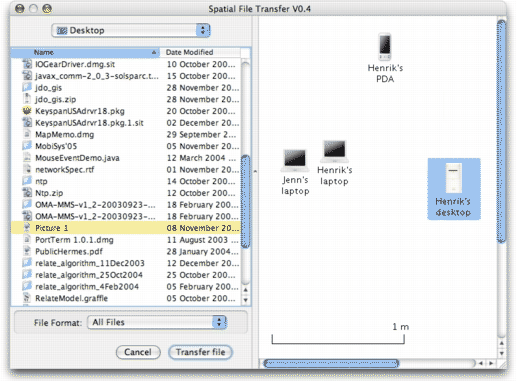
Building on the view provided by the awareness tool, we have prototyped a Relate file transfer application. It allows users to copy files between computers having IP connectivity. The user interface is divided into two panels (figure 9). The left panel is a file browser which is used to select a file on the local computer. The right panel shows the awareness tool view, i.e. the spatial arrangement of nearby Relate devices. Here the user selects the device where the file should be transferred to. The file transfer is initiated by clicking the 'Transfer File' button. Files are copied to a fixed destination folder on the target machine.
The visualisation of the spatial arrangement simplifies the task of selecting a target computer. In particular, the user does not need to know the IP address or name of the computer to which he or she wants to connect. Instead, the graphical visualisation of the spatial arrangement of devices enables the user to compare what they see in the real world (the computers on the table) with what they see on the display. Using the spatial arrangement as the selection criteria is more intuitive than traditional methods of selecting a computer (manually typing an IP address or selecting a computer name from a list) and it works in cases where the name or address of the target computer is not known by the user.
This application makes use of all three services. The visualisation is generated using the query and event services (as described above); the file transfer is performed using the spatial communication service.
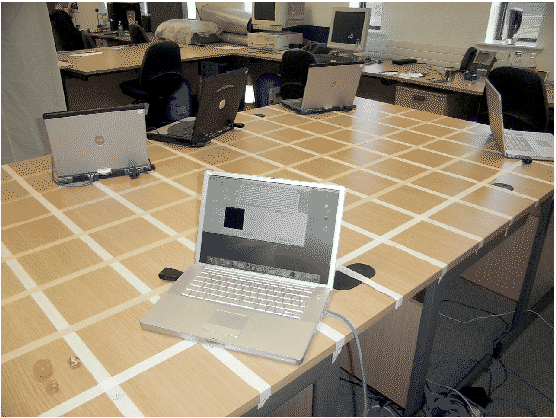
Tests were performed to characterise the performance of the Relate
system. Using five laptops equipped with Relate dongles, measurements
were taken on a ![]() m surface in an indoor office
environment, shown in figure 10. The laptops
used were as follows: two Dell Inspirons and an Acer tablet PC running
Windows XP, one Dell Inspiron running Linux, and an Apple iBook
running Mac OS X.
m surface in an indoor office
environment, shown in figure 10. The laptops
used were as follows: two Dell Inspirons and an Acer tablet PC running
Windows XP, one Dell Inspiron running Linux, and an Apple iBook
running Mac OS X.
For every experiment, each laptop was placed at a randomly generated location and orientation. The actual locations and orientations of the dongles were measured manually with the aid of a reference grid on the surface. The system was then allowed to run for about seven minutes, with positioning model evaluations being triggered every half second on each computer. A software tool which accesses the raw measurements and models through the Relate service layer was used to log the data during the course of each experiment.
In all, over one hundred such experiments were performed. In half of the experiments, the randomly-generated locations and orientations were selected using the constraint that the dongles all have line-of-sight to one another. USB ports on mobile computers are often placed on outward-facing edges, and the dongles protrude by about five centimetres, making line-of-sight achievable in many situations. Nonetheless, it is important to also characterise poor line-of-sight conditions. Thus, the other half of the experiments were conducted with limited line-of-sight between the dongles. For each of these experiments, three out of the ten possible lines of sight between the five dongles were blocked due to the orientation of the laptops.
This subsection presents results characterising aspects of the Relate sensor layer.
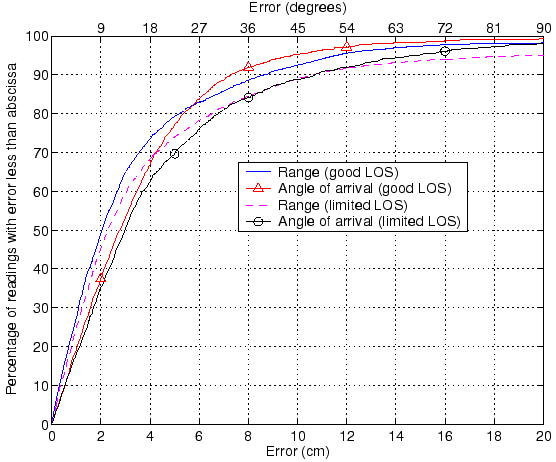
Figure 11 shows the error distribution of the raw range and angle-of-arrival measurements reported by the Relate dongles to their hosts. In good line-of-sight (LOS) conditions, the raw measurements are accurate to within 9 cm and 33° in 90% of cases. As with any ultrasonic ranging device, limited line-of-sight conditions cause a degradation in performance; error in these cases is about 11 cm and 48° with 90% confidence. When line-of-sight between two devices is fully or partially blocked, several factors can contribute to measurement error. First, the tendency of acoustic waves to bend around obstructions can lengthen the measured time-of-flight, reduce the received signal strength, and cause the received pulse shape to vary from the expected shape of a direct-path pulse. Second, the receiver is more likely to identify multipath signals (i.e. reflections) as the valid ranging pulse.
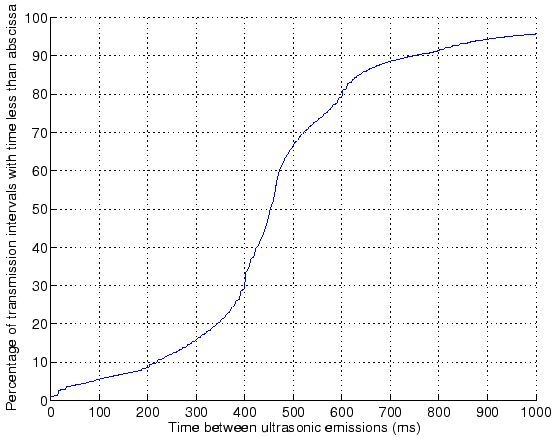
As described in section 3.2, seven 13 ms radio slots are used by each dongle during its transmission sequence. Since the dongles share their views of the network state, each dongle knows how many other dongles are in the system, and waits the required time for the others to transmit before attempting to transmit again. With perfect RF connectivity between the five dongles used in the experiments, a delay of about 450 ms between successive transmissions for a given dongle would be expected.
Figure 12 shows the distribution of the actual times between ultrasonic transmissions. Although the median of the distribution is almost exactly the expected 450 ms, there is some variation due to imperfect RF communication between the dongles. The range of the RFM transceivers used in the dongles is nominally thirty metres indoors. However, this relies upon the use of a certain length antenna, and no nearby obstructions which may cause RF attenuation or multipath. Our implementation utilises a relatively short antenna to minimise obtrusiveness, and the dongles are placed on a surface which tends to further degrade radio communication.
|
Twenty ``start-up'' experiments were performed to explore how long it takes for newly activated dongles to join the Relate network. In these tests, one host device was chosen at random to shut down its dongle. The dongle was then subsequently re-started by the host, in order to simulate a dongle that has just been plugged in. In 95% of cases, the other four dongles in the system successfully detected a radio trigger packet from the newly-joined dongle within 3.7 s after it was started up. The start-up sequence need only be executed once per session, and the delay is well within reasonable expectations for peripheral start-up times--typical USB devices take several seconds to be recognised by the operating system.
In this subsection, the performance of the model layer is characterised. The abstractions and qualitative spatial relationships computed in the model rely upon the relative location and orientation results of the non-linear regression algorithm. Thus, the bulk of the analysis presented here focuses on the regression results.
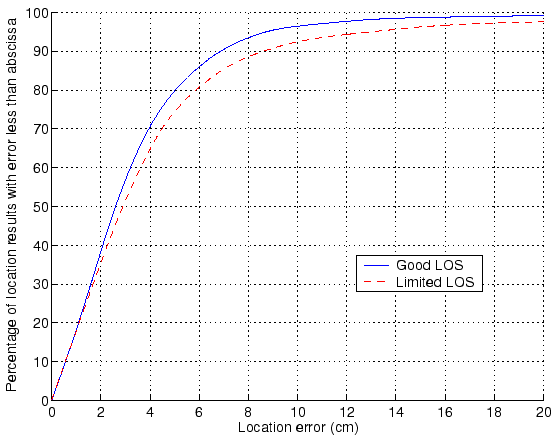
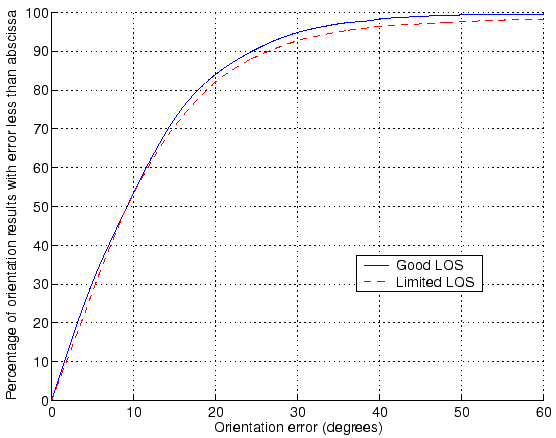
As mentioned in section 4.2.2, the regression algorithm uses Studentized residual analysis to aid in eliminating range and angle-of-arrival measurements which do not fit well with the other measurements. This means that the relative location and orientation results returned by the algorithm have the potential to be more accurate than the raw range and angle-of-arrival measurements reported by the dongles, as shown in figures 13 and 14.
The plots for ``good LOS'' and ``limited LOS'' show the regression algorithm's error when operating on the data reported by each host's dongle independently for the two line-of-sight cases. As described in section 3.4, each dongle relays over USB (1) measurements it has taken using its transducers and (2) measurements taken by other dongles which they have broadcast over the dongle network. The performance of the two line-of-sight cases is summarised in table 2. As expected, the best performance is to be had when good line-of-sight conditions exist. In such cases, the estimates are better than 7 cm and 25° for 90% of the results returned.
Sets of location and orientation estimates which had a high standard error (section 4.2.2) were rejected by the algorithm, and no location/orientation updates were made in the model layer. Limited line-of-sight conditions cause the algorithm to return location and orientation estimates with acceptable standard error about 70% of the time, as shown in the last column of table 2. Location and orientation estimates made during good line-of-sight conditions were more successful, with the regression algorithm returning a result about 88% of the time.
| Ninetieth percentile | Ninety-fifth percentile | Fraction of | |||
| Location | Orientation | Location | Orientation | readings returned | |
| Good LOS | 6.9 cm | 25° | 8.7 cm | 30° | 87.9% |
| Limited LOS | 8.6 cm | 26° | 13.0 cm | 35° | 70.7% |
Accurate, up-to-date location and orientation information is particularly important when devices are on the move. As part of each experiment, a randomly chosen laptop was moved from one location to another on the surface. The approximate time at which the laptop came to a stop was logged, in addition to the dongle's new location and orientation on the surface. In about 15% of the motion experiments, the relative positioning solutions were rejected because they had high standard error estimates. However, in the motion experiments where a valid solution was returned, 70% returned an accurate set of readings within one second after the laptop had come to rest, 90% within five seconds, and 95% within six seconds.
This subsection highlights several issues for further discussion.
The accuracy of the range measurements reported by the dongles is limited by the sampling and computational constraints of the PIC microcontroller. A production version of the system might use faster sampling hardware and a microcontroller more suited to signal processing; this would allow pulse coding and matched filtering techniques to be used to achieve typical range accuracies of 3 cm or better.
Limited line-of-sight conditions affect the rate that new location and orientation updates are applied to the model, since the regression algorithm rejects far more of its computed solutions due to a high standard error estimate. Often, a set of successive regression evaluations are rejected because a number of measurements held in the model are erroneous, and it takes some time for either (1) the measurement to be replaced by a newer, more accurate one, or (2) for the measurement to become old enough to be deleted from the model. Currently, the regression algorithm gives no direct feedback to the model about the measurements. Since the regression algorithm uses the residuals of the measurements to gauge their correctness, one appropriate strategy would be for the regression algorithm to flag measurements having large Studentized residuals. If a particular measurement is repeatedly flagged during several consecutive regression evaluations, it could be struck from the model altogether in order to decrease the number of solutions rejected by the algorithm during subsequent evaluations.
The dongle protocol is designed to support systems of up to twenty dongles, and we have experimentally verified with ten dongles that the system continues to function as expected. However, because the system operation utilises a time-division scheme, its responsiveness begins to suffer when there are larger numbers of dongles present. For example, in a system with thirty dongles, each would only transmit about every four seconds. This can produce quite long delays for up-to-date location estimates to be returned, especially if line-of-sight between the dongles is limited.
As described previously, our implementation of the model layer gathers a number of measurements and every so often evaluates location and orientation using non-linear regression. Although many sets of measurements stored in the model cover a short span of time (typically less than a second), there is still a non-negligible latency between each successive measurement. A constant feed of measurements such as this (often described as ``single-constraint-at-a-time'') is a classic application for Kalman or particle filters. Such methods may be able to provide better continuity between successive location and orientation estimates, since locations and orientations would be updated appropriately with each incoming measurement, and the time difference between measurements would be properly taken into account.
The Relate system described in this paper is distinct in its capability to provide fine-grained, peer-to-peer relative positioning for mobile devices. However, the work is closely related to a number of research efforts which are concerned with sensing and modelling to support spatially-aware behaviour.
An overview of location systems and technologies for mobile and ubiquitous computing is given in [8]. Many of the available location technologies and systems provide information at metre- or room-level accuracy which has been shown to be useful for a wide range of mobile tasks, including discovery of device and user co-location within a certain space or area [14,22]. However, only a few systems reported to date are capable of providing more fine-grained spatial information to devices and users that are already co-located, as targeted by our system. This includes systems using computer vision [3,15], ultra-wide band radio [4] and ultrasonic ranging [18,19,27]. As discussed in the introduction, these systems have the disadvantage of being reliant upon infrastructure deployed in the environment.
DOLPHIN is a location system that utilises peer-to-peer positioning of sensor nodes to provide a more flexible sensing infrastructure in comparison to other indoor location systems [16]. The DOLPHIN devices are particularly similar to the Relate dongles in that they perform bidirectional ultrasonic ranging. In terms of hardware, the DOLPHIN design focuses on omnidirectional range measurements whereas the Relate dongles are optimised for approximately co-planar operation. Relate dongles can also measure pulse angle-of-arrival which helps to more tightly constrain the regression solution, as well as provide orientation information.
In terms of overall system operation, DOLPHIN has two attributes: (1) each node computes only its own location using its own ranging measurements, and (2) the location results produced are absolute, based on a minimal number of reference nodes placed in the environment. In contrast, a Relate dongle collects measurements reported by other dongles (in addition to its own) and passes these to its host, which is responsible for computing purely relative positioning results for all devices in the system. As a result of their contrasting methods of operation, the ad hoc protocols employed by the two systems are fundamentally different.
Close in spirit to our work are a number of approaches that are focused on relative positioning as opposed to absolute location. Approaches to modelling proximity in mobile computing utilise Bluetooth and IrDA device discovery, WiFi cell ID, or radio signal strength. Systems range from bespoke awareness devices that alert proximity of ``friends'' [7,11] to more general frameworks such as the NearMe wireless proximity server [14]. NearMe uses WiFi signals to model device and user proximity by comparing their lists of detected base stations and their signal strengths. An advantage of NearMe is that it does not require additional dedicated sensors but the accomplished accuracy is metre-scale.
The Relate system design emphasises provision of a complete framework from the sensor layer through the model layer to application services. In this respect, it shares an overall approach with the Sentient Computing project [1], the Location Stack [9], and NearMe [14].
The Relate system extends mobile computing devices with a distinct new capability, enabling them to directly establish their spatial relationships when they become co-located. Mobile computers that are augmented with a Relate dongle and software system can acquire fine-grained information about their position and orientation relative to other devices nearby, without need for any infrastructure installed in the environment. This is achieved by the packaging of ultrasonic sensing technology in a novel way as a USB dongle ready for use with everyday mobile computers.
A key feature of the system is the vertical integration, going from the sensor network layer through spatial modelling to provision of a set of application services. This encompasses a variety of methods arranged in a data processing pipeline to extract quantitative as well as qualitative spatial information at various levels of abstraction. The targeted application settings are multi-device and multi-user interaction, and we have included examples in this paper to illustrate how applications can be built on top of the Relate system.
Our experimental results have shown that the sensor and model layers provide relative location and orientation estimates at an accuracy and update rate appropriate for the scenarios we envision; the 90% accuracy is about 8 cm and 25°, and up-to-date estimates can be produced several seconds after a device has been moved.
Acknowledgements. The authors would like to thank Martyn Welch for developing the algorithm which estimates ranging signal angle-of-arrival at the dongle. The work presented in this paper is part of a project (GR/S77097/01) funded by the UK Engineering and Physical Sciences Research Council.
This document was generated using the LaTeX2HTML translator Version 2002 (1.62)
Copyright © 1993, 1994, 1995, 1996,
Nikos Drakos,
Computer Based Learning Unit, University of Leeds.
Copyright © 1997, 1998, 1999,
Ross Moore,
Mathematics Department, Macquarie University, Sydney.
The command line arguments were:
latex2html -split 0 -show_section_numbers -local_icons MobiSys2005.tex
The translation was initiated by Mike Hazas on 2005-05-04
|
This paper was originally published in the
Proceedings of the 3rd International Conference on Mobile Systems, Applications, and Services, Applications, and Services,
June 6–8, 2005 Seattle, WA Last changed: 20 May 2005 aw |
|