LISA '05 Paper
[LISA '05 Technical Program]
NetViewer: A Network Traffic Visualization and Analysis Tool
Seong Soo Kim and A. L. Narasimha Reddy - Texas A&M
University
Pp. 185-196 of the Proceedings of LISA '05:
Nineteenth Systems Administration Conference,
(San Diego, CA:
USENIX Association, December 2005).
Abstract
The frequent and large-scale network attacks have led to an
increased need for developing techniques for analyzing network
traffic. If efficient analysis tools were available, it could become
possible to detect the attacks, anomalies and to appropriately take
action to contain the attacks before they have had time to propagate
across the network. This paper describes NetViewer, a network
monitoring tool that can simultaneously detect, identify and visualize
attacks and anomalous traffic in real-time by passively monitoring
packet headers. NetViewer represents the traffic data as images,
enabling the application of image/video processing techniques for the
analysis of network traffic.
NetViewer is released free to the general public. By employing a
freely available visualization tool, the users of NetViewer can
comprehend the characteristics of the network traffic observed in the
aggregate. NetViewer can be employed to detect and identify network
anomalies such as DoS/DDoS attacks, worms and flash crowds. NetViewer
can also provide information on traffic distributions over IP
address/port number domains, utilization of link capacity and
effectiveness of Quality of Service policies.
Introduction
[Note 1]
The frequent and increasing malicious attacks on network
infrastructure, using various forms of denial of service attacks, have
led to an increased need for developing techniques for analyzing
network traffic. If efficient analysis tools were available, it could
become possible (i) to detect the attacks, anomalies and (ii) to
appropriately take action to mitigate the attacks before they have had
time to propagate across the network or to cripple the infrastructure.
These tools may be in turn useful for traffic engineering purpose
since the network traffic analysis provided by these tools could lead
to the identification of resource bottlenecks and peak usage.
A variety of tools for flow-based measurement have arisen from
both the commercial and free software communities. To study and
classify traffic on the network based on usage and protocols, a number
of tools such as FlowScan [PLO00], Cisco's FlowAnalyzer, and AutoFocus
[ESTsv03], are used as traffic analyzers. While flow-based features
within the network infrastructures are convenient, such approaches may
not be sufficient for reliable and fast application. Some of these
tools provide real-time reporting capability, but much of the analysis
is done off-line. These tools have been effectively utilized for
traffic engineering and postmortem anomaly detection.
However, rigorous real-time analysis is needed for detecting and
identifying the anomalies so that mitigation action can be taken as
promptly as possible. Some of these tools are based on the volume of
traffic such as byte counts and packet counts. When links are not
sufficiently provisioned, normal traffic volumes may reach the
capacity of the links most of the time. In such cases, attack traffic
may not induce significant overshoot in traffic volume (merely
replacing existing normal traffic) and hence may make traffic volume
signal ineffective in detecting attacks.
Sophisticated low-rate attacks [EUZk03] and replacement attacks,
which don't give rise to noticeable variance in traffic volume, could
go undetected when only traffic volume is considered. Furthermore, the
tools which collect and process flow data may not scale to high-speed
links as they focus on individual flow behavior. Our tool tries to
look at aggregate packet header data in order to improve scalability.
Intrusion detection systems (IDS) such as Snort and Bro are an
important part of network security architecture and signature
database-based monitoring of network traffic for predefined suspicious
activity or patterns. These tools are widely deployed by network
administrators. This detection principle relies on the availability of
established rules of the anomalous or suspicious network traffic
activity. While the identification mechanism of the IDS tools provides
fine-grain control of network flows, they however need to be updated
continuously with the latest rules for coping with novel attacks. Our
approach tries to develop a generic mechanism independent of specific
anomalies for improving adaptability.
In this paper, we describe a tool named NetViewer for traffic
anomaly detection based on analyzing the distribution of traffic
header data, in postmortem and in real-time. We adopt a network
measurement-based approach that can simultaneously detect, identify
and visualize attacks and anomalous traffic in real-time. We propose
to represent samples of network packet header data as frames or
images.
With such a formulation, a series of samples can be seen as a
sequence of frames or video. This enables techniques from image
processing and video compression such as scene change analysis and
motion prediction to be applied to the packet header data to reveal
interesting properties of traffic. Our work here brings techniques
from image processing and video analysis to visualization and real-
time analysis of traffic patterns.
We show that "scene change analysis" can reveal sudden changes
in traffic behavior or anomalies [LELs03, ZHAks93, LIEke97, SHEd95,
GYAkc03]. We show that "motion prediction" techniques can be
employed to understand the future patterns of some of the attacks. We
show that it may be feasible to represent multiple pieces of data as
different colors of an image enabling a uniform treatment of
multidimensional packet header data. NetViewer can give an intuitive
and descriptive illustration of network traffic, with visible
features, to network operators.
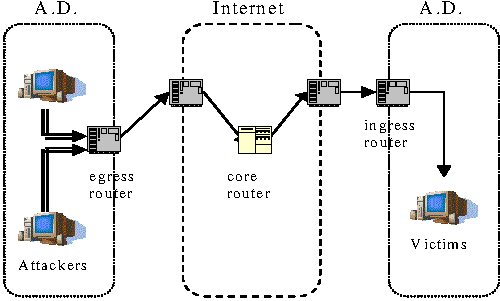
Figure 1: The installation locations of NetViewer. For
ingress/egress filtering, it can be employed in a router or at the
boundary of an administrative domain.
Environment
The visibility of fields in the network packets may be impacted by
the location where traffic is observed. NetViewer can be applied for
analyzing inbound/outbound traffic at administrative domain (AD) edge
router as shown in Figure 1. The AD represents the access link, ISP
(Internet Service Provider) and intra-domain IP-based networks such as
enterprise networks and campus networks.
Employing ingress filtering with NetViewer monitors the flow of
traffic as it enters a network under administrative control. NetViewer
can be combined with a Quality of Service (QoS) policy framework to
rate limit high-bandwidth flows identified by NetViewer.
Egress filtering with NetViewer inspects the flow of traffic as it
leaves a network under administrative control. There are typically
policy regulations for inner machines initiating outgoing connections
to the Internet. Outbound filtering has been advocated for limiting
the possibility of address spoofing, i.e., to make sure that source
addresses correspond to the designated addresses for the AD. Traffic
monitoring at a source network enables a detector to detect attacks
early, to control hijacking of AD machines, and to limit the liability
from such attacks and the squandering of resources. NetViewer can help
prevent compromised systems on a network from attacking systems
elsewhere through egress filtering.
Our traffic attack/anomaly filtering efforts have been targeted at
the edge environment due to resource utilization issues and source
address spoofing concerns.
Goals
NetViewer's goal is not to detect and eliminate the anomalies
eradicatively, but to bring the anomalous traffic under control in
real-time so that the mitigation mechanisms could be deployed fast to
counter the threats of the anomalies. We also want NetViewer to not
contain any legitimate traffic in the process of containing attack
traffic. Our goal is to detect and contain 99.7% of the attack and
anomalous traffic at a false alarm rate of 0.3%. Given the current and
growing network link speeds, anything we implement needs to be fast
and efficient enough to not excessively burden existing network
infrastructure.
As an operational goal, we want that the containment is centrally
processed at a router level, rather than something that the end users
would have to deal with. Netviewer can work with packets on the fly at
a router in real-time mode and packet traces in libpcap or NetFlow
format in post-mortem mode.
Architecture
NetViewer's architecture is mainly focused on performance,
simplicity, and versatility. NetViewer system's architecture consists
of five major software components: the packet parser, the signal
computing engine, the detection engine, the visualization engine and
the alerting engine, which are programmed in ANSI C and Matlab
language [MAT01].
The Packet Parser
The packet parser engine is responsible for collecting and
processing raw packets and traffic data exported from routers.
NetViewer can work with traffic records in postmortem or work with
more aggregate data upon packet arrival in real-time. It can parse
packets on the fly and parse network packet header traces with libpcap
(packet capture library) [PCAP94], Cisco's NetFlow [NETF] and NLANR
formats [NLA02] such as DAG, Coral, and TSH (time sequenced headers).
Traffic volume, such as packet counts, byte counts and the number
of flows, can be used as a signal, and fields in the packet header,
such as addresses, port numbers and protocols, can be employed as an
observed domain. According to operator's concern, NetViewer then
generates images of the distribution of traffic intensity in the
chosen domain. Based on the kinds of traffic data and the header
domain, we categorize the image-based signals into address-based,
flow-based and port-based signals. Address-based signal employs packet
count distribution over address domain (either source address alone,
or destination address alone, or a 2-dimensional source and
destination address domain). Flow-based signal employs the flow number
distribution over address domain(s). Port-based signal employs packet
count distribution over port number domain.
Traffic headers such as addresses and port numbers have larger
spaces over which data is distributed, that is, 232 IPv4
addresses and 216 port numbers. Any developed technique
should be simple enough to be deployable, i.e., should not be
expensive in terms of memory and processing resources. In order to
address the problem of large domain spaces, we have employed a concise
data structure for reducing the domain space [KIMrv04]. We explain
this data structure using address-based signal as an example. This
data structure count[i][j][t] represents
the data sample at time t.
The data structure consists of four arrays count [4] for
the 4 bytes of the IP address. Within each array, we have 256
locations, for a total of 4*256 locations = 1024 locations. By
default, the size of one location is set to 16 bits. A location
count[i][j][t] is used to record the
packet count for the address j in ith field
of the IP address in time interval t. This provides a concise
description of the address instead of 232 locations that
would be required to store the address occurrence uniquely. Upon
packet arrival, the corresponding four positions of the data structure
are updated through scaling.
The Signal Computing Engine
Each sampling period, the packet counts of the entire traffic are
recoded to the corresponding positions of each IP address byte-segment,
and the normalized packet count is quantized and represented
using Equation (1). Each resultant normalized packet count then
represents the intensity of the corresponding pixel in the image
representation of the traffic as shown in Figure 2.
In order to quantitatively analyze the network traffic anomalies,
we compute correlation and deltas based on normalized packet counts.
Consider two adjacent sampling instants. We can define correlation
signal at sampling point t by (2-1), which measures correlation
of traffic intensity at a particular address. Delta is defined as the
difference of normalized packet counts by (2-2), which is a useful
signal at the beginning and ending of attacks.
We employ the variance of pixel intensities in the image as
traffic signal for scene change analysis, which is denoted by
 . Using the variance
of these image signals for deriving thresholds, we can obtain an
approximation of the energy distribution of the normalized packet
counts within the observation domain as follows: . Using the variance
of these image signals for deriving thresholds, we can obtain an
approximation of the energy distribution of the normalized packet
counts within the observation domain as follows:
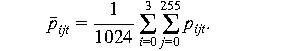
 where pijt are pixel intensities and
Upon each sampling instant, the aggregate traffic signal is
instantaneously calculated based on accumulated data structure for
real-time analysis.
The Detection Engine
The detection engine employs a theoretical basis for deriving
thresholds for analyzing traffic signals and anomaly detection. For
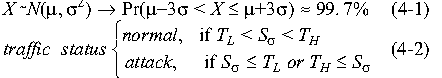
3 -based statistical analysis,
we set two kinds of thresholds, a high threshold TH
and a low threshold TL. When we respectively set
the TH and TL thresholds to -based statistical analysis,
we set two kinds of thresholds, a high threshold TH
and a low threshold TL. When we respectively set
the TH and TL thresholds to
 3 of aforementioned traffic signal
distributions in ambient traffic, attacks can be detected with an
error rate of 0.3% (if the signal is normally distributed) which
can be expected as target false alarm rate as (4-1) [NIS05]. For
deriving initial thresholds from background traffic, a tune-up
procedure is necessary just after powering up. By default, it is
set to 120 samples; that is 2 hours in case of 1 minute samples.
To analyze the statistical properties of normal traffic dynamically,
we employed an exponential weighted moving average (EWMA) of normal
traffic free of attacks. The dynamic average of the traffic is
updated at every sampling point excluding attack periods. 3 of aforementioned traffic signal
distributions in ambient traffic, attacks can be detected with an
error rate of 0.3% (if the signal is normally distributed) which
can be expected as target false alarm rate as (4-1) [NIS05]. For
deriving initial thresholds from background traffic, a tune-up
procedure is necessary just after powering up. By default, it is
set to 120 samples; that is 2 hours in case of 1 minute samples.
To analyze the statistical properties of normal traffic dynamically,
we employed an exponential weighted moving average (EWMA) of normal
traffic free of attacks. The dynamic average of the traffic is
updated at every sampling point excluding attack periods.
The detection engine can judge the current traffic status by
calculating the standard intensity deviation of signals in each
sampling instant by (4-2). The analyzed information will be compared
with historical thresholds of traffic to see whether the traffic's
characteristics are out of regular norms. Sudden changes over 3
in the analyzed signal are expected to indicate anomalies.
Also, with mean, standard deviation and signal value at every
sampling point, the detection engine would compute the probability of
anomaly assuming the normal distribution [KILn02, NIS05].
The Visualization Engine
The visualization engine employs graphic library of Matlab (in
this implementation) for displaying traffic signals and images. The
visualization engine produces user-friendly, images of network
traffic. As shown in Figure 2, the visual parts of NetViewer's main
screen make up four primary components: the general traffic profile,
traffic distribution signals, traffic images and anomaly reports.
While the profiling and reporting components are expressed in text,
the traffic signals and images are visualized in graphs. The
visualization engine enables NetViewer to offer these visual
measurements as a real-time motion picture. It could help the network
operators recognize the trends and transitions in network traffic.
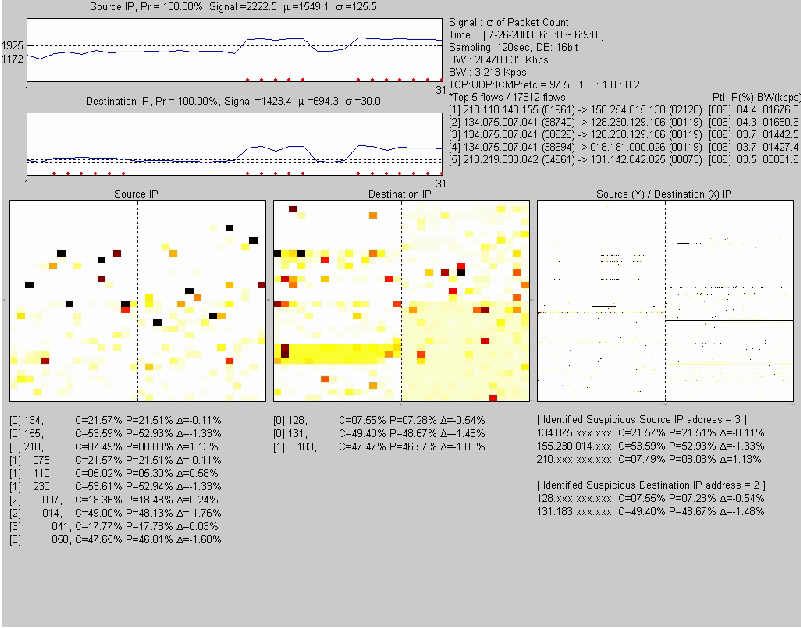
Figure 2: A running example of NetViewer.
The visualization engine plots the standard deviation of traffic
intensity computed by (3) versus the sampling instant in source and
destination domains respectively as network traffic signals. If the
anomaly is detected, a red dot is marked on the bottom and calls the
network operator's attention. NetViewer's viewing window is
controllable for short-term and long-term analysis purposes. By
default, the window is 60 sampling points, which is the latest 1 hour
with 1 minute samples.
Each element of the data structure computed by (1) corresponds to
a rectangular area (or pixel) in the traffic image. The values of the
elements of the data structure are indexed into the current color-
table that determines the color of each pixel. The color of each pixel
shows the intensity of traffic at the source or destination or
(source, destination) pair in 2-dimensions.
The descending order of intensity is black, red, orange, yellow
and white. Each quadrant corresponds to each byte in IP address
structure. In 1-dimensional source or destination domain, each
quadrant consists of 16 by 16 pixels for mapping 256 elements of one
byte of IP address as shown in Figure 3(a). Each quadrant maps the 0
to 255 values of one byte of IP address in a row-major order. Thus
four quadrants consist of the entire 4-byte IP address. The four bytes
0 to 3 of IP address are also organized as quadrants in a row-major
order. In 2-dimensional image, the x-axis in each quadrant corresponds
to the distribution of the destination IP addresses, and y-axis that
of the source addresses as shown in Figure 3(b). In each quadrant,
source and destination addresses consist of 256 by 256 pixels.
The Alerting Engine
Once anomalies are detected through scene change analysis, the
alerting engine scrutinizes the above quantities by (1) and (2) for
identification purposes. From the predefined correlation and delta
thresholds, the alerting engine can identify the IP addresses of
suspicious attackers and victims. Based on the revealed IP addresses,
we closely investigate each address on the basis of statistical
measurements. This inspection will lead to some form of a detection
signal that could be used to alert the network administrator of the
potential anomalies in the network traffic. The alerting engine
generates the detection reports in online image as well as in an
offline file.
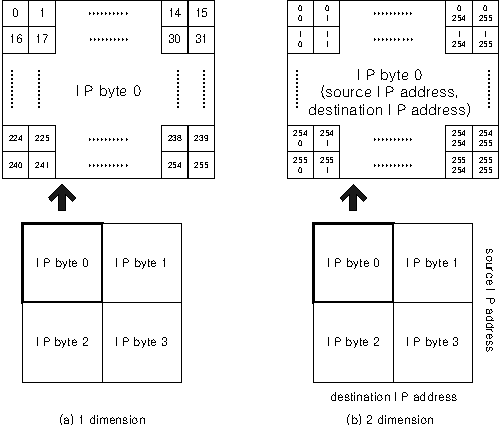
Figure 3: The visualization of the network traffic
signal in the IP address domain.
NetViewer's Functionality
NetViewer and its component engines are responsible for profiling
and monitoring raw packets or trace data exported from routers.
NetViewer monitors each packet and maintains data structures based on
the observed domain (address, port numbers etc.). When anomalies are
detected, NetViewer reports its detection results and may optionally
take containment actions. It may be configured to either archive for
postmortem analysis or discard the counter contents after processing.
Controllable parameters, such as window size for determining the
amount of retained data and thresholds, can be configured before or
after the packet parser engine takes an action. By default, a sampling
interval is set to 60 seconds for deriving most stable traffic images,
and a sampling duration ratio is 1:1. That is to say, we sampled for
30 seconds and paused for 30 seconds for reducing the processing
requirements. Our techniques are light-weight enough for traffic to be
continuously sampled without any pause periods.
Figure 2 is a sample NetViewer graph of real traffic with attack
at an access link.
Traffic Profiling Function
The upper right text in Figure 2 shows the general information of
current network traffic. The profile includes the selected signal
type, the local time, the selected sampling period, number of bits
used to represent traffic intensity of individual pixels in the data
structure, and the bandwidth in Kbps (bits per second)
and Kpps (packets per second).
The next line illustrates the proportion occupied by each traffic
protocol. It is possible to determine whether the
current traffic is behaving normally through correlating it to that of
previous states of traffic from a protocol viewpoint. This is based on
the observation that during the attacks, the protocol employed by the
attack traffic should see considerably more traffic than during normal
traffic.
The Top 5 flows term shows the topmost five flows
out of the total flows in the selected traffic volume, which can be
packet count, byte number or the number of flows. It is expressed as a
quintuple of source IP address/port number and destination IP
address/port number, exploited protocol, occupied proportion in
percentage, and bandwidth in Kbps. It is implemented using LRU (Least
Recently Used) policy with partial state for identifying long-term
high-rate flows [SMIkr01].
The profiling information presented by NetViewer assists in
understanding the general nature of the traffic at the monitoring
point.
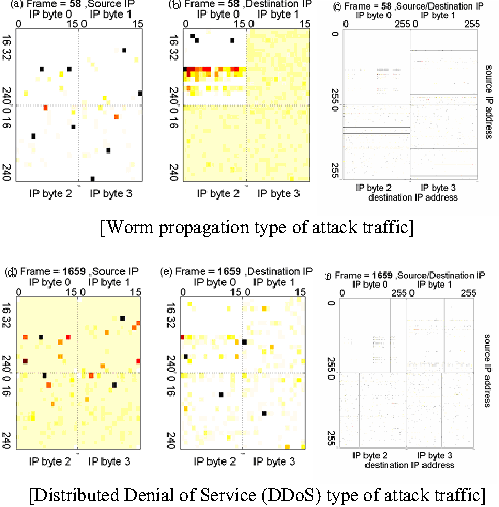
Figure 4: Various attack images reported by
NetViewer.
Monitoring Function
The two upper left sub-pictures in Figure 2 illustrate traffic
distribution signal over the latest predefined (and adjustable) time-
window. These two pictures map to source domain and destination domain
respectively. The captions above each picture explain the current
traffic distribution. The Source IP term means that this
signal is originated from packet counts in the source IP address
domain. Based on the operator's selection, this term can be changed to
Source FLOW which analyzes the number of flows over the
source IP address domain, or to Source PORT which
analyzes packet counts in the source port domain, or to Source
MULTIDIMENSIONAL which analyzes multiple components of
different distributions in the source IP address domain.
The Pr term estimates the anomalous probability of
current traffic distribution assuming Gaussian distribution. The
probability is computed from the normal distribution table based on
the traffic signal, its
 and
[NIS05]. We can be informed
the possibility of anomalous traffic quantitatively. The
Signal term is computed by (3). The "" and
"" terms mean the mean value and the standard deviation of
distribution signal using EWMA. The left two figures in y-axis and
dotted vertical lines illustrate the
3
levels respectively.
The above statistical measurements are dynamically updated at every
sampling point excluding attack periods.
and
[NIS05]. We can be informed
the possibility of anomalous traffic quantitatively. The
Signal term is computed by (3). The "" and
"" terms mean the mean value and the standard deviation of
distribution signal using EWMA. The left two figures in y-axis and
dotted vertical lines illustrate the
3
levels respectively.
The above statistical measurements are dynamically updated at every
sampling point excluding attack periods.
The red dots located on the bottom of the each sub-picture are
marked when 3-based statistical
analysis detects anomalies. The detection signal automatically
triggers to identify the IP addresses of sources and destinations
and can be used to alert traffic anomalies to the network operator.
Anomaly Reporting Function
The center three sub-pictures in Figure 2 illustrate image-based
traffic in the source/destination IP address domain and the
2-dimensional domain.
The color and darkness of each pixel indicate the intensity of
traffic of corresponding IP address. In case of normal traffic, the
aggregate traffic does not form any regular shape due to
dispersibility of traffic of various and numerous flows in time and
space. In the case of abnormal traffic, however, the traffic pattern
of network may change and these changes could be exhibited in the
visual images. From destination IP address in Figure 2, a specific
area of IP byte2 is shown in a darker yellow shade. It illustrates
that the current traffic is concentrated on a (aggregated) single
destination or a subnet. NetViewer also shows that a specific source,
i.e., an attacker, monopolizes network traffic, shown in the form of a
line in the 2-dimensional domain.
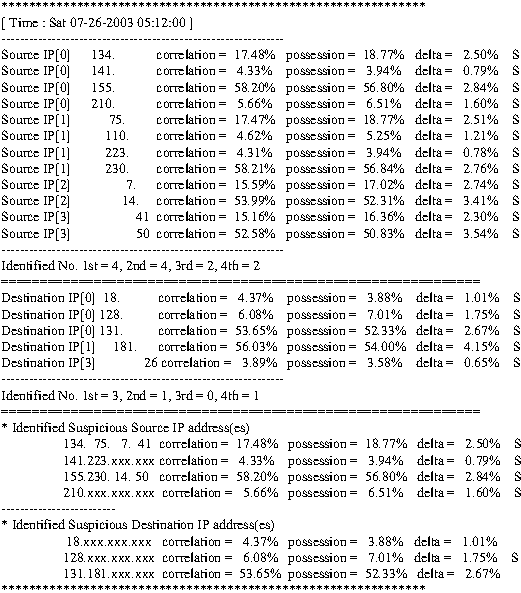
Figure 5: The detection report of anomaly
identification (with anonymized IP addresses).
The exposed images can show various kinds of patterns according to
the nature of attacks. Figure 4 shows the visual expression of a worm
and a DDoS attack respectively. While the horizontal lines imply that
the same source targets multiple destinations in a worm attack, the
vertical lines reveal that several machines (in a subnet) are
targeting a single server in a DDoS attack.
Once anomalies are detected, the identified IP addresses of
sources and destinations are revealed in byte-segment level and 4-byte
whole structure simultaneously as shown in the lower text of Figure 2.
These identified IP addresses are quantitatively investigated on the
basis of statistical measurements using the correlation
(C), the possession ratio (P), the
delta ( ) between consecutive frames and the black list
(S) computed by the signal computing engine.
S recorded in the last column indicates black listing
which is successively identified and refined over recent sampling
instances. It could help network operators make a final decision. ) between consecutive frames and the black list
(S) computed by the signal computing engine.
S recorded in the last column indicates black listing
which is successively identified and refined over recent sampling
instances. It could help network operators make a final decision.
Additionally the detection report is optionally generated in a
file format. The upper part of Figure 5 shows the identified addresses
responsible for the anomalies over the four byte-segment levels and
the lower part of Figure 5 illustrates source and destination
addresses of attacks.
Auxiliary Function
NetViewer could support various auxiliary functions. The
video/frame representation of network traffic enables motion
estimation based techniques for attack prediction. Unassigned address
ranges can be clearly marked in the generated images to identify
address spoofing. We describe some of these functions here.
Multidimensional Image
Up to now, we have focused on address-based image on which
normalized packet counts are visualized in the address domain. By the
operator's selection, NetViewer's main screen can be changed to flow-
based image which visualizes the number of flows over the address
domain, or to port-based image which displays packet counts in the
port domain, or to multidimensional image which simultaneously
exhibits multiple components of different images in the address
domain.
In multidimensional images, individual components, such as packet
counts, the number of flows and the correlation of the packet counts,
can be represented as different components (for example, Y, U, V) of
an image or different primary colors (R, G, B). With the three
distinct traffic components, NetViewer can comprehensively analyze the
traffic properties of each IP address from diverse viewpoints.
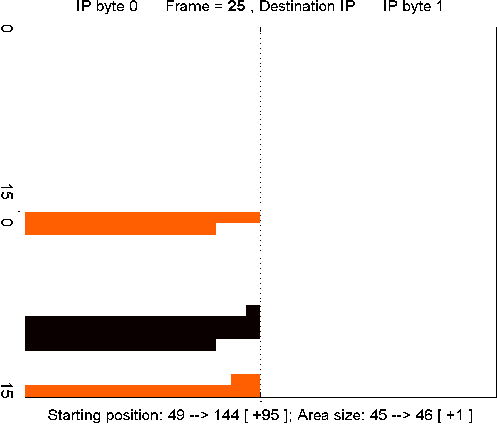
Figure 6: Potential attack estimation in red using
motion prediction.
Attack Tracking
During some attacks, a concentrated attack is circulated on the
address space. Using motion prediction, it is possible to expect or
anticipate the next set of target addresses in such attacks. NetViewer
estimates the locations of the next attack using modified motion
prediction scheme. The results from such an analysis on a predictable
attack are shown in Figure 6. Figure 6 shows the ongoing attacked
parts in black and the result of motion prediction (in red pixels)
indicating the next set of addresses that may be a target of this
attack. The next potential attack ranges are estimated based on the
starting positions of current attack and the motion vector length. The
attack tracking would be displayed on NetViewer's subsidiary screen.
Automatic Spoofed Address Masking
In bandwidth consumption attacks such as traditional flood-based
attacks, the source IP address of the packet could be usually spoofed
through the abuse of raw sockets function or the like. The deliberate
falsification is often forged in random order or in a dictionary
order. Random destination addresses may also be employed during
probing for possible infiltration. SQL Slammer was the representative
random propagation worm [CER03]. And the portscan-based attacks
heavily exploit the destination port numbers in random or sequential
order.
Global address allocations are organized by types, which are
classified according to prefixes. Currently, many portions of the IP
address space are still unassigned by IANA (Internet Assigned Numbers
Authority) [IPV04]. Especially, the unallocated address space can be
clearly identified in the first byte image in NetViewer. Moreover, if
NetViewer is located at the boundary of the AD, the system
administrator can make sure that addresses correspond to the locally
designated addresses for the AD. The packets coming into and going out
of the AD should have the destination address and the source address
assigned to the AD, respectively. The masking can be also applied to
unavailable port services against portscan attacks if the network
operator selects the NetViewer's port-based functions.
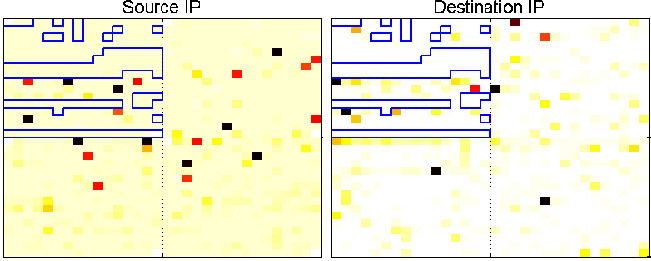
Figure 7: Spoofed source IP addresses.
Figure 7 shows the portion of NetViewer, where the blue-colored
polygons indicate the reserved IP address space by IANA at the time of
this writing. In legitimate traffic, there should be no pixels
matching the unassigned space as shown in the destination IP image.
Since packets can not be allowed to originate from or be destined to
these spaces, the (colored) pixels matching the unallocated space have
to be from spoofed IP addresses as shown in the source IP image. This
attack is an instantaneous attack with (randomly) spoofed source
addresses which aimed at a specific machine with 160 byte-sized
packets.
The spoofed address masking can be expanded to IP bytes 1, 2 and 3
as well because the system operator knows the AD's internal usable
address range (for stub networks). This also enables detection of
sequential portscan attacks through the identification of addresses
that do not provide service at the designated ports.
How Is NetViewer Different From IDS?
Network intrusion detection system (NIDS) is an important part of
network security area and signature-based detection approach is being
widely employed by network operators. The rule-based matching
mechanism requires that the completed analysis of attack patterns and
the availability of established remedies be available beforehand. To
cope with new attacks, IDS tools are continuously required to be
updated with the latest rules. Currently there are a few available
freeware/shareware and commercial IDS tools.
We review Snort as representative IDS [ROE99], [SNO], and compare
the properties of Snort and NetViewer. We perform this comparison by
running the systems on a live, production network. We report results
from a time period which contained a large number of anomalous traffic
transactions.
For our experiments, we installed Snort in Texas A&M University
network environment, and gathered the detection results of Snort. We
evaluate NetViewer on a trace of network traffic analyzed by the Snort
system. Our experiment is carried out by capturing 24 hours of data on
April 28th and 29th, 2004. After the basic configuration is performed,
we turn on the IDS rules, and begin to monitor the Analysis Console
for Intrusion Databases (ACID) [ACI].
Snort
The snort system reported 13,257 alerts distributed over the
experiment time period. We compare it with results from NetViewer
based on address-based signal. In the trace, it is apparent that there
are continuous anomalies over almost the entire time period.
NetViewer's detection result generally agrees with the results of
Snort. Both Snort and NetViewer detect suspicious anomalies throughout
the course of the trace capture. The detection performance could be
considered at a similar level.
However, Snort's identification mechanism is superior in
granularity. When coupled with a mechanism such as ACID, Snort can
more readily identify the source of malicious activity, and what
exactly that activity consists of. Snort provides an easily managed
display of IP addresses and port numbers of any suspicious activity.
On the other hand, when NetViewer performs the analysis, it reports
the suspicious IP addresses and the pattern of abnormality in an
aggregated fashion.
While Snort employs a qualitative analysis, NetViewer employs a
quantitative analysis. During our evaluation, Snort missed the
identification of many heavy traffic sources. Some flows, using the
BitTorrent system run by one of the users of the network, accounted
for about 30% to 60% traffic over certain time periods. However,
without the operational rule, Snort did not detect these flows.
However, NetViewer identified this flow as an anomalous event. This
demonstrates the utility of measurement-based approaches in detecting
previously unknown or undocumented anomalous behavior.
Regarding the computational complexity, Snort looks at the payload
of packet as well as the packet header. And currently over 2,400
filter rules are established [SNO]. NetViewer works on aggregated
information from traffic samples. Snort would require more computing
resources to be able to match NetViewer performance against heavy
traffic.
From these above observations, we feel the two methods could be
combined to provide a more complete detection system capable of
detecting a wide array of different network security violations.
Availability
Information and source code of NetViewer may be acquired directly
from the following web site at
https://dropzone.tamu.edu/~skim/netviewer.html.
Conclusion
In this paper, we have presented an approach which represents
traffic data as images or frames at each sampling point. Such an
approach enabled us to view traffic data as a sequence of frames or
video and allowed us to apply various image processing and video
analysis techniques for studying traffic patterns. We have
demonstrated our approach through an analysis of real traffic traces
obtained at various major networks. Our results show that our approach
leads to useful traffic visualization and analysis. We have studied
detection and identification approaches along multiple dimensions of
IP packet header data such as addresses, port numbers, and the number
of flows.
We compared our approach with a signature-based IDS system. Our
results indicate that measurement based statistical approaches can be
simple and effective and could be combined with IDS approaches to
enable more effective monitoring of network traffic.
Acknowledgment
We are very grateful to Roger Heiniluoma for his assistance and
comments as the system administrator, to Mr. Il Sun Hwang and Dr.
Okhwan Byeon at KISTI for their help in accessing KREONet2 traces.
Author Information
Seong Soo Kim received his B.S. and M.S. degrees in electrical
engineering from Yonsei University, Seoul, Korea, in February 1989 and
February 1991 respectively, and the Ph.D. degree in computer
engineering in the Department of Electrical Engineering at Texas A&M
University in May 2005. During his MS degree at Yonsei, he was
supported by an LG Fellowship. He worked in the areas of
analog/digital consumer electronics and home networking as a research
engineer at LG Electronics Co., Ltd. of Korea from January 1991 to
August 2001. His research interests are in computer network security,
multimedia including image and signal processing, and stochastic
processing. He received an "outstanding research engineer" award at
LG in 1995 and received a "Patent-Technology" award from the
national patent officer in 1996. He has 31 domestic (registered or
pending) patents and five international patents. His personal homepage
is https://dropzone.tamu.edu/~skim
and e-mail address is
kimseongsoo2@hotmail.com.
A. L. Narasimha Reddy received his B.Tech. degree in Electronics
and Electrical engineering from the Indian Institute of Technology,
Kharagpur, India, in August 1985, and the M.S. and Ph.D. degrees in
Computer Engineering from the University of Illinois at Urbana-
Champaign in May, 1987 and August 1990, respectively. At the
University of Illinois at Urbana-Champaign, he was supported by an IBM
Fellowship. He is currently a professor in the Department of
Electrical Engineering at Texas A & M University. He was a research
staff member at IBM Almaden Research Center in San Jose from August
1990 to August 1995. Reddy's research interests are in network
security, network QoS, multimedia, I/O systems and computer
architecture. Currently, he is leading projects on building scalable
network security solutions and wide area storage systems. Prof. Reddy
is a member of ACM SIGARCH and is a senior member of IEEE Computer
Society. He received a US National Science Foundation CAREER Award in
1996. He received outstanding professor awards at Texas A & M
University during 1997-1998 and 2003-2004.
References
[ACI] Analysis Console for Intrusion Databases (ACID),
https://www.cert.org/kb/acid.
[CER03] CERT Coordination Center (CERT/CC), "CERT Advisory
CA-2003-04 MS-SQL Server Worm,"
https://www.cert.org/advisories/CA-2003-04.html, January, 2003.
[ESTsv03] Estan, C., S. Savage and G. Varghese, "Automatically
Inferring Patterns of Resource Consumption in Network Traffic,"
Proc. of ACM SIGCOMM 2003, Karlsruhe, Germany, August 2003.
[GYAkc03] Gyaourova, A., C. Kamath, and S.-C. Cheung, "Block
matching for object tracking," LLNL Technical report, UCRL-TR-200271,
October, 2003.
[IPV04] "Internet Protocol v4 Address Space," https://www.iana.org/assignments/ipv4-address-space
April, 2004.
[KAMfmk05] Kamra, A., H. Feng, V. Misra and A. D. Keromytis,
"The Effect of DNS Delays on Worm Propagation in an IPv6 Internet,"
Proc. of IEEE INFOCOM 2005, Miami, FL, March, 2005.
[KILn02] Kilpi, Jorma and Ilkka Norros, "Testing the Gaussian
approximation of aggregate traffic," Proceedings of ACM SIGCOMM
Internet Measurement Workshop (IMW) 2002, Marseille, France,
November, 2002.
[KIMrv04] Kim, Seong Soo, A. L. Narasimha Reddy and Marina
Vannucci, "Detecting traffic anomalies using discrete wavelet
transform," Proc. of International Conference on Information
Networking (ICOIN) 2004, LNCS Vol. 3090, pp. 951-961, Busan,
Korea, February, 2004.
[KUZk03] Kuzmanovic, A. and E. Knightly, "Low-Rate TCP-Targeted
Denial of Service Attacks," Proc. of ACM SIGCOMM 2003,
Karlsruhe, Germany, August, 2003.
[LELs03] Lelescu, Dan and Dan Schonfeld, "Statistical Sequential
Analysis for Real-time Video Scene Change Detection on Compressed
Multimedia Bitstream," IEEE Transactions on Multimedia, Vol.
5, Issue 1, pp. 106-117, 2003.
[LIEke97] Lienhart, R., C. Kuhmunch, and W. Effelsberg, "On the
Detection and Recognition of Television Commercials," Proc. Of the
International Conference on Multimedia Computing and Systems, pp.
509-516, Ottawa, Canada, 1997.
[MAT01] The MathWorks Inc., MatLab software, ver 6.1.0.450
Release 12.1, May, 2001.
[NETF] Leinen, Simon, "FloMA: Pointers and Software, NetFlow,"
August, 2002.
[NIS05] NIST/SEMATECH e-Handbook of Statistical Methods,
https://www.itl.nist.gov/div898/handbook/eda/section3/eda3671.htm,
April, 2005.
[NLA02] National Laboratory for Applied Network Research (NLANR),
Measurement and Operations Analysis Team, "NLANR Network Traffic
Packet Header Traces," https://pma.nlanr.net/Traces, August, 2002.
[PCAP94] Jacobson, Van, Craig Leres and Steven McCanne, libpcap,
Lawrence Berkely National Laboratory, https://www-nrg.ee.lbl.gov/,
1994.
[PLO00] Plonka, Dave, "FlowScan: A Network Traffic Flow
Reporting and Visualization Tool," Proc. of USENIX 14th System
Administration Conference (LISA) 2000, New Orleans, LA, December,
2000.
[ROE99] Roesch, Martin, "Snort-Lightweight Intrusion Detection
for Networks," Proc. of USENIX 13th Systems Administration
Conference (LISA) 1999, Seattle, Washington, USA, November, 1999.
[SHEd95] Shen, K. and E. J. Delp, "A fast Algorithm for Video
Parsing Using MPEG Compressed Sequences," IEEE Conference on Image
Processing, pp. 252-255, 1995.
[SMIkr01] Smitha, I. Kim and A. L. N. Reddy, "Identifying long
term high rate flows at a router," Proc. of High Performance
Computing, Hyderabad, India, December, 2001.
[SNO] Snort, https://www.snort.org/.
[ZHAks93] Zhang, H., A. Kankanhalli, and S. W. Smoliar,
"Automatic partitioning of Full-motion Video," Multimedia
Systems, Vol. 1, Num. 1, pp. 10-28, https://www.switch.ch/tf-tant/floma/software.html#netflow, 1993.
Appendix A
The ANSI C codes below are what we used to record packet count into data
structure in the packet parser.
for ( ip_field=0; ip_field<4; ip_field++ ) {
#if SOURCE_IP_BASED                          /* which domain is observed */
    ip_addr = packet->src_ip;
#endif
#if DEST_IP_BASED
    ip_addr = packet->dest_ip;
#endif
    /* From byte0 to byte3 */
    if( !ip_field )
        addr_field = (unsigned char)(((ip_addr)&0xff000000)>>24);
    else if ( ip_field == 1 )
        addr_field = (unsigned char)(((ip_addr)&0x00ff0000)>>16);
    else if ( ip_field == 2 )
        addr_field = (unsigned char)(((ip_addr)&0x0000ff00)>>8);
    else
        addr_field = (unsigned char) ((ip_addr)&0x000000ff);
    DS[ip_field][addr_field]++;              /* updating counters */
}
Appendix B
The following ANSI C scripts are used for computing the statistical
measurements in the signal computing engine.
typedef unsigned int   uint;                 /* 32 bit */
typedef unsigned short DS_Size;              /* 16 bit data struct resolution */
for( ip_field=0; ip_field<4; ip_field++ ) {
    window = (DS_Size *) DS;
    for( addr=0; addr<256; addr++ ) {
        if( *(window+addr) > 0 )
             t_count   +=   *(window+addr);  /* t_count = sum(count[i][j][t]) */
    }
    for( addr=0; addr<256; addr++ ) {          /* p(i, j, t) */
         pkt_ratio  =   (double)DS[ip_field][addr]/(double)t_count;
                                /* count[i][j][t] / sum(count[i][j][t]) */
         current_pkt_cnt  =  pkt_ratio  *  (double)Entry_Limit;
                                /* Entry_Limit is 65,536 in 16-bit */
         norm_DS[ip_field][addr]  =   (DS_Size)floor(current_pkt_cnt);
                                /* normalized packet count */
    }
    for( addr=0; addr<256; addr++ ) {          /* C(i, j, t) */
        scaled_pkt_cnt = (uint) norm_DS[ip_field][addr] *
                                             (uint) norm_DS_old[ip_field][addr];
        current_pkt_cnt = (double)scaled_pkt_cnt / (double)Entry_Limit;
        scaled_pkt_cnt = (uint)ceil(current_pkt_cnt);
        norm_DS_C[ip_field][addr] = (DS_Size)scaled_pkt_cnt;
                                               /* Delta(p(i, j, t)) */
        signed_scaled_pkt_cnt = (int) norm_DS[ip_field][addr] -
                                              (int) norm_DS_old[ip_field][addr];
        DS_D[ip_field][addr]= (signed_DS_Size)signed_scaled_pkt_cnt;
    }
}
Appendix C
The Matlab codes below are what we used to create our visualization
engine.
block(1) = load(sprintf(norm_DS_Src),  '-ascii');
              %  reading  a  normalized packet count file in source domain
block(2) = load(sprintf(norm_DS_Dst), '-ascii'); % in destination domain
block_2D = load(sprintf(norm_DS_2D), '-ascii');  % in 2-dimensional domain
Sig_stddev = std(block(1,:));                % std dev of image in source domain
Sig_stddev_M = mean(Sig_stddev( : ));        % avg of normal traf. free of attack
dev = abs(Sig_stddev_M  -  Sig_stddev);      % deviation = abs(mean - signal value)
       % Calculate the probability between (mean- dev) and (mean+dev)
pr  =  normcdf([Sig_stddev_M-dev Sig_stddev_M+dev], Sig_stddev_M, Sig_stddev_S);
       % visualizing traffic signal
plot(Sig_stddev(1, :),'-b','LineWidth',1); hold on;  % source domain
plot(Sig_stddev(2, :),'-b','LineWidth',1); hold on;  % destination domain
       % traffic image in 1-dimension
range = [0,pow2(DS_Resolution) - 1];         % resolution is 16 bits
for io = 1: 1: 2                             % source to destination domain
    imagesc(block(io), range); hold on;
    colormap(hot);
end
       % traffic image in 2-dimension
imagesc(block_2D, range); hold on;
colormap(hot);
Footnotes:
Note 1: This work is supported by
NSF grants ANI-0087372, 0223785, Texas Higher Education Board,
Texas Information Technology and Telecommunications Taskforce and
Intel Corp.
|