Each host has multiple attributes comprised of its operating system and network services, and together these attributes determine its configuration. The distribution of configurations among the hosts in the system determines the difficulty of finding core replica sets. The more configurations shared by hosts, the more challenging it is to find small cores.
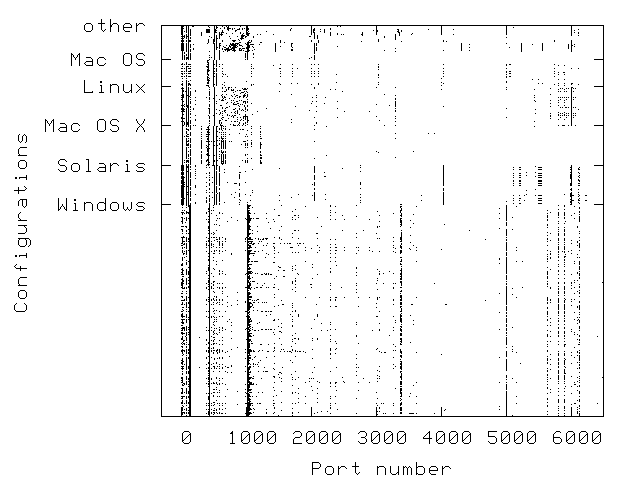
Figure 1 is a qualitative visualization of the space of host configurations. It shows a scatter plot of the host configurations among the UCSD hosts in our study. The x-axis is the port number space from 0-6500, and the y-axis covers the entire set of 2,963 host configurations grouped by operating system family. A dot corresponds to an open port on a host, and each horizontal slice of the scatter plot corresponds to the configuration of open ports for a given host. We sort groups in decreasing size according to the operating systems listed in Table 2: Windows hosts start at the bottom, then Solaris, Mac OS X, etc. Note that we have truncated the port space in the graph; hosts had open ports above 6500, but showing these ports did not add any additional insight and obscured patterns at lower, more prevalent port numbers.
Figure 1 shows a number of interesting features of the configuration space. The marked vertical bands within each group indicate, as one would expect, strong correlations of network services among hosts running the same general operating system. For example, most Windows hosts run the epmap (port 135) and netbios (port 139) services, and many Unix hosts run sshd (port 22) and X11 (port 6000). Also, in general, non-Windows hosts tend to have more open ports (8.3 on average) than Windows hosts (6.0 on average). However, the groups of hosts running the same operating system still have substantial diversity within the group. Although each group has strong bands, they also have a scattering of open ports between the bands contributing to diversity within the group. Lastly, there is substantial diversity among the groups. Windows hosts have different sets of open ports than hosts running variants of Unix, and these sets even differ among Unix variants. We take advantage of these characteristics to develop heuristics for determining cores in Section 5.
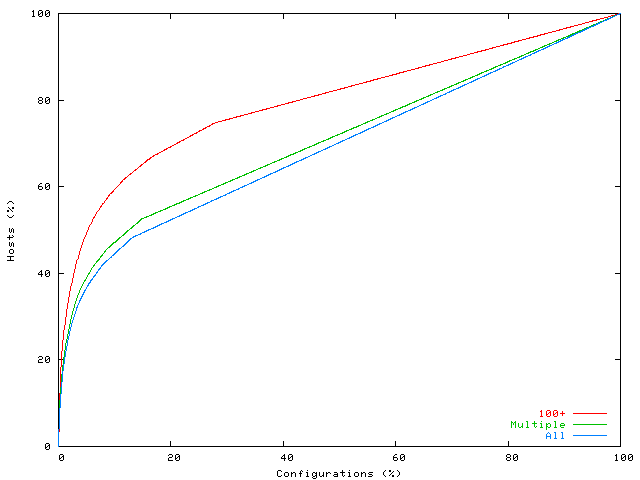
Figure 2 provides a quantitative evaluation of the diversity of host configurations. It shows the cumulative distribution of configurations across hosts for different classes of port attributes, with configurations on the x-axis sorted by decreasing order of prevalence. A distribution in which all configurations are equally prevalent would be a straight diagonal line. Instead, the results show that the distribution of configurations is skewed, with a majority of hosts accounting for only a small percentage of all configurations. For example, when considering all attributes, 50% of hosts comprise just 20% of configurations. In addition, reducing the number of port attributes considered further skews the distribution. For example, when only considering ports that appear on more than one host, shown by the "Multiple" line, 15% of the configurations represent over 50% of the hosts. And when considering only the port attributes that appear on at least 100 hosts, only 8% of the configurations represent over 50% of the hosts. Skew in the configuration distribution makes it more difficult to find cores for those hosts that share more prevalent configurations with other hosts. In the next section, however, we show that host populations with diversity similar to UCSD are sufficient for efficiently constructing cores that result in a low storage load.