|
USENIX '05 Paper
[USENIX '05 Technical Program]
Ourmon and Network Monitoring Performance
James R. Binkley Bart Massey
Computer Science Dept.
Portland State University
{bart,jrb}@cs.pdx.edu
Abstract:
Ourmon is an open-source network management and anomaly
detection system that has been developed over a period of
several years at Portland State University. Ourmon monitors
a target network both to highlight abnormal network traffic
and measure normal traffic loads. In this paper, we
describe the features and performance characteristics of Ourmon.
Ourmon features include a novel mechanism for running
multiple concurrent Berkeley Packet Filter (BPF) expressions
bound to a single RRDTOOL-style graph, as well as various
types of "top talker" (top-N) filters aimed at conventional
network flow measurements and anomaly detection. These
features permit a variety of useful and easily-understood
measurements.
One problem that sniffer-based network monitor systems face
is network-intensive attacks that can overwhelm monitoring
and analysis resources. Lab experiments with an IXIA
high-speed packet generator, as well as experiences with
Ourmon in a real network environment, demonstrate this
problem. Some recent modifications to Ourmon have greatly
improved its performance. However, minimum-size packets in a
high-speed network can still easily make a host lose packets
even at relatively slow rates and low monitor workloads. We
contend that small packet performance is a general network
security problem faced by current monitoring systems including
both open source systems such as Ourmon and
Snort, and commercial systems.
1 Introduction
The Ourmon [15] network monitoring system is an
open-source tool for real-time monitoring and measurement of
traffic characteristics of a computer network. It runs on FreeBSD,
and Linux. (There is also code for Solaris, although it is
currently unmaintained.)
Ourmon's feature set includes various top talker filters
and multiple instances of the Berkeley Packet Filter (BPF) which
taken together allow us to capture interesting
features of the envelope of incoming IP packets. Network
monitoring and data visualization are typically performed on
separate hosts. The data visualization system uses standard
network graphical tools to display the resulting
measurements in a fashion that highlights anomalies.
The Internet has recently faced an increasing number of bandwidth-intensive
Denial-Of-Service (DOS) attacks. For example, in January 2003 the
Slammer worm [4,12] caused serious disruption.
Slammer not only wasted bandwidth and affected reachability, but
also seriously impacted the core routing infrastructure. At Portland
State University (PSU), four lab servers with 100 Mb NIC cards were infected
simultaneously. These servers then sent approximately 360 Mb/s of
small packets to random destinations outside of PSU. This attack
clogged PSU's external connection to the Internet, in the process also causing
important network monitoring failures. Due to the semi-random
nature of the IP destination addresses generated by the worm, the
CPU utilization of a router sitting between network engineers and
network instrumentation rose to 100%. Engineers were thus cut off
from central network instrumentation at the start of the attack.
We recently acquired an IXIA 1600 high-speed packet
generator. The Slammer attack inspired us to test our
Ourmon network monitoring system against a set of
Gigabit Ethernet (GigE) flows. Our test flows included
maximum-sized (1518 byte) and minimum-sized (64 byte) UDP
packets, with both fixed and rolling IP destination addresses.
The Ourmon network measurement system architecture consists of two
parts: a front-end probe and a back-end graphics engine
system. Optimally these two parts should run on two separate
computers in order to minimize the application compute load on the
probe itself. Our goal in these experiments has been to test the
performance of our probe and its BPF network tap rather than the back-end system.
We constructed a test system consisting of: the IXIA with two
GigE ports; a line speed GigE switch capable of
port-mirroring; and a FreeBSD workstation with a GigE NIC card.
The IXIA was set up to send packets from one GigE port
to the other. The switch was set up to mirror packets
from one IXIA port to the UNIX host running our front-end probe.
Like other tools including
tcpdump [19],
Snort[16],
or Ntop [5,14], the Ourmon front-end uses the BPF as a
packet tap. The application takes a stream of
unfiltered packets directly from a BPF kernel buffer fed by an Ethernet device, bypassing the
host TCP/IP stack. The interface interrupts on packet input, and
hands the trimmed packet (containing all headers
through layer 4) to the kernel
BPF filter buffer. The Ourmon probe application reads
packets, subjecting each packet in turn to a set of configuration
filters. It thus makes sense to separately test the performance
of the BPF and the performance of the Ourmon probe filter system.
Our experimental questions include the following:
- Using GigE with maximum or minimum-sized packets, at
what bit rate can the underlying packet tap and buffer system
successfully process all packets?
- Using GigE with maximum or minimum-sized packets,
what is the smallest BPF kernel buffer size (if any) for
which all packets are successfully processed?
- Ourmon has three kinds of filters: hardwired C
filters, BPF-based interpreted filters, and a ``top-N''
flow analysis system (one of a set of top-N tuple types).
Can we determine anything about the
relative performance of these filters? If we are
receiving a high number of packets per second, which of
these filters can keep up?
- With the Slammer worm, we know that semi-random IP
destinations led to inefficient route caching in
intermediary routers. What happens when we subject our
top-N flow filter to rolling or semi-random IP destinations?
In section 2
we provide a short introduction to the Ourmon system.
In section 3 we discuss our test setup.
In section 4 we present test results.
In section 5 we discuss possible means for
improving our performance, including several small-scale application optimizations
that have shown reasonable performance improvements.
In section 6 we present related
work. Section 7 contains a
discussion of problems and future work.
Section 8 draws some brief conclusions.
2 Introduction to Ourmon
Our measurement work in subsequent sections focuses on the
Ourmon probe rather than the graphics engine. However, in
this section we give an overview of the complete Ourmon
system. This serves to introduce Ourmon and to describe the
basis of
the measurement effort. To further these goals, we discuss the system
at a high-level, introducing the basic feature sets which we call
filters. We provide some probe configuration examples
and a few sample visualizations. All visualizations
have been taken from actual data produced from the Ourmon probe
stationed in PSU's ``network center'' or DMZ. Ourmon is a complex
system. While detailed workings of every feature of the Ourmon system
are outside the scope of this paper, we attempt to give an
overall understanding of system operation.
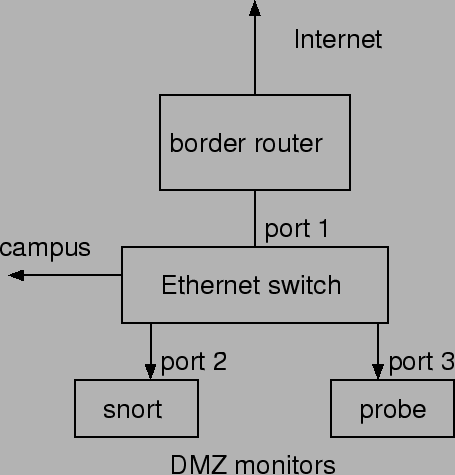
Ourmon is a ``near'' real-time web-based network monitor.
Web-based data never lags reality by greater than one minute. The
system (and its name) are inspired by SNMP RMON [22] monitors. The Ourmon
probe assumes the port-mirroring functionality of Ethernet-based
switches. A typical setup may be seen in
Figure 1. Ourmon can be configured in many ways.
At PSU, the Ourmon probe
is placed in an internet gateway network so that we can see all traffic going to
and from the Internet.
In addition, within the PSU Maseeh College of Engineering
and Computer Science, we use an
Ethernet switch and set Ourmon up to watch important server traffic. An Ethernet
switch is configured to mirror (duplicate) packets sent to its
Internet connection on port 1. All packets received via the
Internet port are copied to port 3, which is running the front-end
Ourmon probe on a FreeBSD system using the BPF packet tap. Thus
the probe setup is similar to that of Snort, which we show running
on port 2 of the switch. The back-end graphics engine is not
performance critical. It may run on a second computer, which need
not be exposed to the Internet.
Figure 1:
Ourmon network setup
 |
The probe, written in C, has an input configuration file and a
main output statistics file. (Depending on the features used, other
output files are possible.) The configuration file,
ourmon.conf,
specifies various named filters for the probe to use. Typically
probe output is written to a small ASCII file,
mon.lite,
that summarizes the last 30 seconds of filter activity in terms of
statistics recorded by each configured filter.
Ourmon takes copious packet data and tries to summarize it in a
statistical way, typically producing integers bound to BPF-based
filters or lists of tuples. Tuples may
be top-N flows or other top-N tuples typically keyed to an IP source
``host''. The goal is to produce small amounts of
heavily summarized output data. All probe inputs and outputs
are in simply-formatted ASCII, facilitating
analysis and tool-based processing.
If the graphics-engine is on a separate computer,
the resulting output files may be copied over the network to that box.
The graphics engine, in turn, produces various graphic outputs and ASCII reports
for web display. This file transfer is a simple task,
accomplished using standard UNIX tools. One
typically uses a batch ssh script driven by crontab
to accomplish the transfer by pulling data from the probe. Other
file transfer programs including rsync, wget, or even
NFS will also work. The probe is protected from
unauthorized access via a host-based
access control list.
The graphics engine, written in Perl, produces several kinds of
graphics and reports. RRDTOOL-based [17] strip charts
are used with BPF filter-sets and hardwired filters. A filter-set is a set of BPF
expressions bound to a single RRDTOOL graph. RRDTOOL
graphs are wrapped in
HTML web pages to ease access. Web pages constituting a
year of baselined data are available via the RRD logging system.
Histograms and reports are used to display the top-N flow filter
and other similar "top talker" tuple lists. A variety of
logging is performed: raw logging of
probe output; individual logs per top-N tuple; and report
summarizers for some of the more interesting tuples.
The resulting reports provide both hourly summaries for the
current day, and summary data for the last week. Ourmon does not
include a web server (we typically use apache). Our basic install
provides a default installation of BPF-based filter-sets and top talker web pages,
with individual web pages per filter, as well as a top-level
web page for accessing the data.
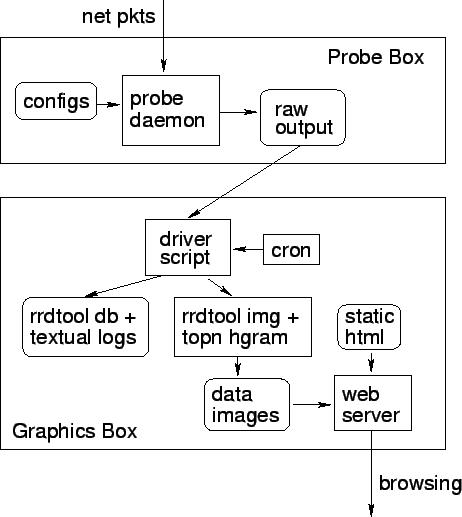
Figure 2 shows the overall Ourmon system
architecture. Upon installation, our configuration
utility creates probe and graphics engine shell scripts.
In the back-end graphic box, it also installs a set of static
web pages which encapsulate runtime generated graphics and reports.
The probe is started and stopped via its shell script and runs as a background daemon.
It typically runs at boot. It takes the ourmon.conf input file, parses it, and then
reads packets from the command-line specified network device.
It outputs various files depending upon configured filters including
the primary mon.lite file and other optional secondary tuple files.
The graphics engine script is responsible for
transferring the raw probe data files to the display
machine (if necessary), and invokes analysis tools to
produce graphics for the web interface and also produces log information. The graphics
engine script is invoked by cron once per minute and actually runs
to completion twice per minute - hence the sample period is thirty seconds.
The graphics engine places the graphics and some analyzed report data
in the web output directory thus refreshing the data encapsulated by
the web pages installed at configuration time. The script here also
produces logging information not available on the web, which may be looked
at for layer analysis. The user interface for the resulting display of data
is the user's web browser of choice.
Figure 2:
Ourmon software architecture
 |
The Ourmon web interface is quite simple. Ourmon can be
observed in operation in the PSU DMZ by visiting
https://ourmon.cat.pdx.edu/ourmon with a graphical web
browser. From there, a variety of RRDTOOL and other filter outputs
are available. More reports can be
accessed simply by clicking on the appropriate links.
The top-level web page in general shows current RRDTOOL pictures,
current histogram pictures for top-N data and also has links
to some kinds of sample period or summarized daily reports. The top page may be viewed as a directory
for the various RRDTOOL filters, and other kinds of filters.
This is because it is intended that there should be at least one
current picture for every filter type on the top level page. The top picture
may in turn lead to a link that provides more filter details on lower level pages.
If we focus on RRDTOOL filters, each filter has its current graph for today
on the top-level page with "now" on the right-hand edge of the picture.
That graph in turn is a link that leads
to a second-level page that has graphs for the current day (roughly),
the current week, the current month, and the current year. Thus each RRDTOOL
filter provides a year's worth of baselined data (this is a typical
RRDTOOL toolset feature and is not a noteworthy Ourmon feature).
Top-N data is similar. The current picture for the top 10 tuples is shown on the top page,
and that picture in turn is a link to a second-level page that provides
supplemental tuples. Because the current Ourmon front page is quite large, it is
not practical to provide a screenshot. However, the displays shown in
this paper give a good indication of the kinds of graphical display available.
The Ourmon probe process uses the BPF in two ways. The BPF
library is used to
extract packets from the kernel BPF buffer system. Ourmon also allows the
administrator to evaluate multiple concurrent BPF expressions in user
mode. In the probe configuration file, a user can group logically
related BPF expressions in a BPF filter-set. Each
expression in the set can be graphed as a separate line in a shared RRDTOOL strip
chart graph in the back-end. Such filter-sets have a name, provided
by the user in the front-end config. The back-end uses the
filter name to synthesize an RRDTOOL database expression,
and to create runtime graphics for any new filter-set. We
provide a collection of BPF filter-sets with our default install,
many of which perform useful network anomaly detection tasks.
It is also easy to configure new graphical outputs for
Ourmon data. Graphical outputs are described
using the "tcpdump" expression language as found in
libpcap [19]. Tcpdump and other common network
tools also use these filters. After creating a new probe
configuration filter, the user must give it
a unique name. A small amount of HTML, copied from our template
files, is usually sufficient to glue the new filter to the supplied main page.
We hope
to further automate this process in a future release. Thus Ourmon may be
easily extended by a user with a new BPF-based set of expressions.
As one example, Figure 3 shows a simplified probe configuration for one
BPF filter-set. This filter-set groups the performance of
five application services together and uses one BPF expression
each for ssh, combined P2P protocols, web, FTP, and
email.
Probe output is not intended for human consumption, but is
useful for debugging. The probe output for
the filter above over a snapshot period might look like this:
  bpf:ports:5:ssh:254153:p2p:19371519:
   web:41028782:ftp:32941:email:1157835
Thus
ssh/p2p/web/ftp/email byte counts will all appear in the same RRDTOOL
graph as in Figure 4.
Figure 3:
Ourmon probe configuration
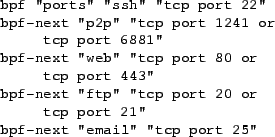 |
Figure 4:
A BPF filter-set graph showing application byte counts
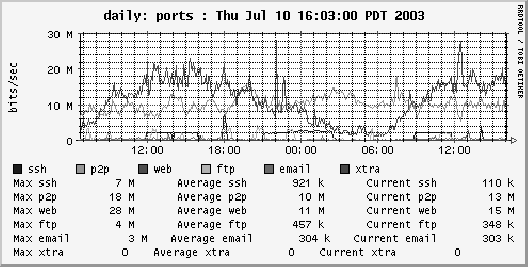 |
The filter configuration allows the user to name the composite
filter-set graph
``ports''.
This is accomplished using the ``bpf''
configuration tag. This tag provides a line
label and initial expression for the graph. The configuration tag
``bpf-next'' adds another BPF expression to the graph. The graph
may be terminated one of several ways, including a new
``bpf''
tag,
which starts a new graph. Overall, five separate user-mode BPF
configuration expressions like ``tcp port 22'' are mapped to
appropriate line labels (``ssh'') in the same graph. (This graph
is taken from the PSU DMZ and shows web traffic and P2P traffic as
the biggest bandwidth consumers.) The probe executes the user-mode
BPF runtime expressions on the incoming packet stream from the
packet tap, counting matching bytes or packets. At the sample period timeout,
it outputs the mon.lite file. In this case, the file includes the
name of the filter-set and line label / byte count tuples
for each BPF expression. Note that multiple BPF filter-sets are
possible. Thus many separate BPF expressions can be executed in the probe
application. At the time of writing, the current PSU DMZ probe
software is running around 80 BPF expressions in twenty filter-sets.
Ourmon also supports a small set of ``hardwired'' filters programmed in C
and turned on via special filter names in the configuration file. For example, a hardwired filter
counts packets according to layer 2 unicast, multicast, or broadcast destination address types.
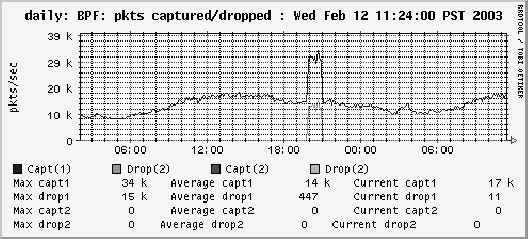
One very important filter called the packet capture filter includes
statistics on dropped and counted packets provided directly from the BPF kernel code.
The packet capture filter is fundamental. It is used to determine
when the kernel BPF mechanism plus application mix is overloaded in our testing. Typical
front-end output in the mon.lite file for that filter and
the layer 2 packet address type filter might look like this:
  pkts: caught 53420 drops: 0
  fixed_cast: mcast: 2337215:
   unicast: 15691896: bcast: 0:
The packet capture filter (``pkts'') output shows that the packet tap during the last sample
period caught 53240 packets and dropped none. In Figure 5
we show an example back-end graph for this filter. The
upper line in the figure indicates captured packets: the
lower line indicates drops. This graph is from our DMZ during
the day of a Slammer re-infection. It can be
seen that the Ourmon probe, at the time running on a
Pentium-3, has caught the attack even
though many packets have been dropped. This is a real-world example
of small packets causing a monitor system to underperform. We have also
seen distributed TCP SYN attacks cause the same phenomenon.
Figure 5:
The packet capture filter graph showing counts and drops
during a slammer attack
 |
The third and last filter class in Ourmon are top-N based filters.
Top-N filters produce a sublist of limited
set size: the top-N elements of the entire sorted list.
The list is characterized by a tuple that includes a key
and a set of integer counters. In some cases a nested list of tuples
might include sampled destination ports or other data.
Tuple keys may be as simple as an IP source
address.
This has proven to be a very profitable focus for network summarization and anomaly
detection.
An IP flow from the top-N flow
filter can also be a tuple key.
Tuple-based filters currently include:
- The traditional top-N talker flow filter that tells us
the top IP, TCP, UDP, and ICMP flows. We view this filter
as typical of its class: in this paper we focus only
on measurements related to this filter.
- A top-N port monitor that tells us which TCP and UDP
ports are the most used.
- A top-N TCP SYN monitor that is quite useful in anomaly
detection. It includes a basic top talker graph to tell us which
IP hosts are sending the most SYNS. It also includes several important
anomaly detection functions including a port signature report
that reveals "noisy" hosts with a set of sampled destination ports.
These hosts are typically P2P systems or scanners or hosts infested
with worms. An RRDTOOL-based worm graph gives us a
count of such noisy hosts at any one time. This SYN tuple filter
is the focus of much ongoing research.
- A top-N scanning monitor that tells us which hosts
are doing IP destination scanning, and which hosts are doing
L4 (TCP and UDP) destination port scanning.
- A top-N ICMP error monitor that tells us which
hosts are generating the most ICMP errors and as a side
effect, which systems have created the most ICMP errors with UDP packets.
When configured to use the top-N flow filter, the probe builds up
a hash-sorted list of IP flows over the sample period and writes
the top-N, say 10 to 100, IP flows to the main output file.
It also writes subsets of the IP flow including TCP, UDP, and ICMP
flows. The graphics-engine takes this
information and produces graphical histograms and text report
summaries hourly. The key for this tuple type is a flow.
A flow is a
five-tuple consisting of IP source, IP destination, IP next protocol,
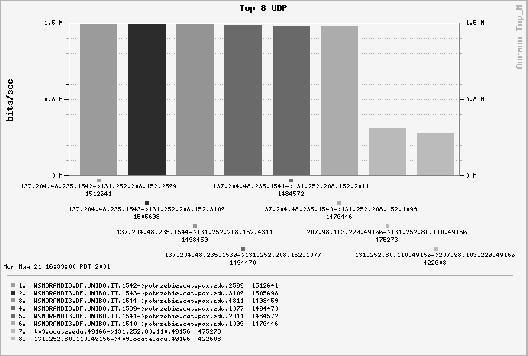
L4 source port, and L4 destination port. See Figure 6 for
an example of back-end graphics for the top-N report: we show a DOS
attack on a local IT administrator's host machine. The top six flows
in the graph constitute the attack. The attack packets were launched
over Internet2 using a spoofed IP source address and unfortunately
clogged our Internet1 connection (a DS-3 at the time). Multiple
UDP flows, each around 1.5 Mb/s, are shown. This picture is
of historic significance to us as it was discovered during a ``demo'' on the first day that Ourmon
was ever deployed in PSU's network. This result emphasized to us the fact
that Ourmon is not just a networking monitoring system, but also an anomaly detection system.
Figure 6:
Top-N UDP flow histogram showing a DOS attack
 |
In summary, the front-end has three kinds of filters: hardwired C
filters, user configurable BPF filter-sets, and top-N tuples including
a flow filter. We are interested in the execution
cost of each of these three kinds of filters. Of our tuple types,
we have chosen the top-N flow filter as representative of
its class. It is also the first filter type developed in its class so we thus
have the most experience with it.
A user may program any number of BPF filter-sets and this complicated the analysis somewhat.
The packet capture filter is especially important, as it serves to tell us when we are losing
packets. We can view this as an important indicator that the
combined kernel and probe application system is in failure mode.
An important cause of failure is too much work done at the application
layer, causing the application to fail to read buffered kernel
packets in a timely manner.
3 Experimental Setup
The hardware used in our testing consists of three pieces of equipment:
- An IXIA 1600 chassis-based packet generator with a two port GigE line card.
One port sends packets and the other port receives packets.
- A Packet Engines line speed GigE switch. Three ports on
the switch are used: one for the IXIA send port, one for the IXIA receive port, and a third port connected
to the UNIX host for mirroring the IXIA flow.
- A 1.7 GHz AMD 2000 computer system.
The AMD processor is roughly comparable to a 2GHz Intel Pentium 4 processor.
The system motherboard is a
Tyan Tiger MPX S2466N-4M. The motherboard has two 64-bit PCI slots. We use a
SysKonnect SK-9843 SX GigE card in one of the slots.
Software used includes Ourmon 2.0 and 2.4,
(2.4 at the time of writing), along with the 0.7.2 libpcap [19] library.
The host operating system is FreeBSD 4.9, running only the Ourmon front-end probe.
We set up the IXIA to send either minimum-sized packets
or maximum-sized Ethernet packets. One port on the
IXIA sent packets through the switch to the other IXIA port.
All packets were UDP packets.
The IXIA allows the user to select an arbitrary
packet sending rate up to the maximum possible rate.
It can also auto-increment
IP destination addresses. We used this feature as an additional test
against the top-N filter.
According to Peterson [7]
the maximum and minimum theoretical packet rates for
GigE are as shown in
Table 1. We used these values as a measurement baseline.
We observed
that the IXIA 1600 can indeed generate packets at nearly 100% of
this rate for both maximum and minimum-sized packets. We used these
numbers to make sure that our Ethernet switch did not drop packets.
We hooked both IXIA GigE ports up directly to the switch and
sent packets from one IXIA port to another. The
IXIA's built-in counters at the receive port reported the same
packet counts as at the send port.
Table 1:
GigE rates
| |
B/pkt |
pkt/s |
| min |
64 |
1488000 |
| max |
1518 |
81300 |
The test methodology involves setting up a UNIX host
with a driver script and some set of Ourmon filters.
The
front-end probe is started, and the IXIA is configured to
send min or max packets
at some fraction of the maximal rate. Ourmon is configured
with some combination of hardwired, user-mode
BPF, and the top-N filter as desired. The test flows are then
started on the IXIA, and the results observed using
the mon.lite output file.
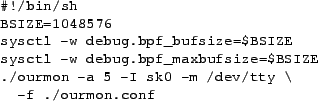
The test script is the Bash Shell script shown in Figure 7.
The FreeBSD sysctl(8) command is used to set the
kernel BPF buffer size. This is because recent versions of the pcap(3) library
on FreeBSD will automatically size the buffer to be used by the client application to match
the kernel buffer size. It should be noted that the traditional size of the kernel BPF
buffer is typically small (a few KB/s), as it was originally intended for
the tcpdump sniffer. The parameters to the Ourmon
probe program tell it to take input from a local configuration
file, to dump the output information to
the screen every five seconds, and to use the SysKonnect card as the input
interface.
Figure 7:
Test script
 |
Tests were run using either maximum-sized or minimum-sized
packets. If we dropped packets, we attempted in every case
to eliminate packet drops by increasing the kernel BPF buffer
size (BSIZE above). If that failed, we then reduced
the IXIA's send rate until all packets were transmitted.
For testing, we identified five interesting categories of Ourmon filters
and constructed filter tests for these categories.
- null: The packet capture filter is on by default
and is the only filter used.
- hard: The hardwired C filters as a group.
- bpf: BPF filters as one or more filter-sets.
- top-n: The top-N flow filter mechanism.
- combo: A simple combination of all filters.
The null filter tells us whether or not the BPF in
the kernel was losing packets, as its count/drop
information is taken from the operating system. The hard,
bpf, and top-N filter categories were tested individually in order
to determine if the filter type itself had an impact on the
overall performance. The six hardwired C filters available
at the time of testing were used in the tests.
The bpf tests were based on a filter-set that
had 4 simple expressions in it. The individual BPF expressions were
configured to capture TCP ports that could not match the output of
the IXIA (UDP packets). It seemed reasonable for BPF expressions to always
fail to match.
Repeatedly testing the top-N filter with the same IP flow
would yield no new information. Therefore, for the top-N
test we used a rolling IP destination setup where each
subsequent UDP packet within a set of 1000 or 10000 had a
different IP destination. This could be said to be a rough
simulation of the Slammer worm, with its variation in IP
destinations.
4 Test Results
Test results fall into two basic categories, which are
reported separately: tests with maximum-sized packets, and
tests with minimum-sized packets.
1 Maximum Packets
In this set of tests, packets were always 1518 bytes, the normal maximum
MTU for Ethernet packets. (This works out to a 986 Mb/s flow of UDP
packets). Tests included the null, hardwired, top-N (with different
destination flow counts), bpf, and combo tests.
The test results are summarized in Table 2.
Table 2:
Maximum Packet Tests
| test |
BPF |
top-n |
BPF |
drop |
| |
sets |
flows |
min (KB/s) |
rate |
| null filter |
|
|
128 |
0% |
| hardwired |
|
|
128 |
0% |
| top-n |
|
1000 |
128 |
0% |
| top-n |
|
10000 |
XXX |
80% |
| BPF |
1 |
|
128 |
0% |
| BPF |
4 |
|
128 |
0% |
| BPF |
8 |
|
128 |
20% |
| BPF |
8 |
|
7168 |
0% |
| test config |
1 |
1000 |
7168 |
0% |
The flow rate was set to maximum. The drop rate therefore shows packets
lost at GigE speeds. In the null case,
the configuration almost worked with the typical BSD default BPF buffer size
of 4 KB/s. However, some packets were lost at a 30 second
interval. This may have had something to do with an operating system timer.
Increasing the kernel BPF buffer size to 128 KB/s resulted in perfect
transmission, even after adding in
the hardwired filters.
The top-N flow filter
worked with no loss at 1000 flows and completely failed at
10000 flows. Larger BPF buffers did not help
(shown as XXX in the table). This is the most significant failure
case with maximum-sized packets. Decreasing
the IXIA flow rate to 45 Mb/s resulted in perfect
transmission.
For the bpf tests, we increased the number
of filters to 8 sets (32 BPF expressions) before running into some loss.
At that point, we increased the kernel BPF buffer size. We found that a very
large buffer of 7 MB/s could indeed get us back to lossless transmission.
With the combo configuration (hard + top-n + 1 bpf set)
we did not experience any loss. Note however that we used
only 1000 flows with the top-N filter.
2 Minimum Packets
Attempts to capture maximum-rate flows of minimum-sized
packets (64 bytes) uncovered serious problems. We
therefore report our results as a series of small
experiments. Each
experiment focuses on a different test domain.
1 Null Filter Only
With the null filter, we are not doing any
significant application work. Consequently, this test
determines whether the kernel driver and buffer subsystem plus
the application read can actually capture packets.
It was not always possible
to capture all packets even in the null filter case.
Instead we attempted to determine
the effect of the kernel BPF buffer size on drop rates as
shown in table 3.
Table 3:
Minimum Packets and Null Filter
| BPF buff (KB/s) |
drop thresh (Mb/s) |
| 32 |
53.33 |
| 128 |
68.52 |
| 256 |
76.19 |
| 512 |
76.19 |
A buffer size of 256 KB/s appears optimal. At this size
the system begins to drop packets at 76 Mb/s. Larger kernel buffers
do not improve the result. Of course the most important aspect
of this test is that we cannot capture more than around 10% of the
GigE stream without loss. (Note that packet overhead for minimum packets
results in a maximum data flow of around 760 Mb/s.)
2 Individual Filter Types
Having determined baseline drop rates using the null filter,
we could now proceed to measure the impact of other filter
types. In the bpf filter-set tests, we tried both one and
two filter-set configurations. In the top-N filter test, we
varied the number of simultaneous flows. Table 4 shows
the results for the hard and bpf tests. Table 5 shows the results for the top-N tests.
Table 4:
Hardwired and BPF Tests
| test |
BPF sets |
flow (Mb/s) |
drops |
| hardwired |
|
76 |
0% |
| BPF |
1 |
68 |
0% |
| BPF |
2 |
53 |
0% |
Table 5:
Minimum Packets--top-N Tests
| flows |
drops |
buffer (KB/s) |
flow (Mb/s) |
| 1 |
0% |
256 |
76 |
| 100 |
1% |
256 |
76 |
| 1000 |
25% |
256 |
76 |
| 1000 |
0% |
256 |
45 |
| 10000 |
50% |
* |
* |
Hardwired filters appear to have no impact on performance.
The bpf filters
have some performance impact, visible even at a modest 76 Mb/s
transfer rate.
At this transfer rate, 1000 unique flows is stressful for the top-N filter.
However reducing the flow rate to 45 Mb/s allows the filter to
keep up with the data. 10,000 unique flows cannot be handled
with any kernel buffer size at any measured transfer rate.
3 Combination filtering
In this experiment we measure the combo filtering
previously discussed. Here we vary only the flow rate,
holding the buffer size constant at 256 KB/s and the number of
flows constant at 1000. Table 6 shows the
results.
Table 6:
Minimum Packets--All Filter Types
| flow (Mb/s) |
drops |
| 76 |
44% |
| 68 |
37% |
| 53 |
18% |
| 45 |
03% |
| 38 |
0% |
We see that we must reduce the flow rate to roughly one-half maximum
in order to prevent drops.
This is probably because of the impact of 1000 flows on the top-N filter.
The filters here are in truth
fairly minimal, as there is only one BPF filter-set.
In reality one would want more filter-sets
to get better traffic information. The bottom line
is that we must reduce the flow rate to 38 Mb/s
for even a modest amount of work to be performed without packet loss.
Not only are small packets hard to deal with even for
bare-bones applications that do no real work in processing
them, but real levels of work will likely reduce the amount of processing power
to very small throughput rates.
5 Mitigation
The poor performance of the Ourmon probe on even modest
flows of small packets was of obvious concern. In the real world in PSU's DMZ
we feel that Ourmon is useful as an anomaly detector
even under conditions of severe packet loss. Indeed, such a
loss constitutes an anomaly indicator in its own right.
Nonetheless, the exhibited performance of Ourmon in the lab on
minimum-sized packets was unexpectedly poor. This poor
performance was a threat to some of the conclusions reached
in real-world use. Several strategies were thus pursued in
improving probe efficiency.
The top-N flow filter has been both one of Ourmon's most useful
tools and one of its least performant. It was observed that
the hashing/caching strategies and data structures used in
the initial implementation of this feature could be vastly
improved. In optimizing the flow filter code, our main
strategy was aimed at improving the runtime hashing mechanism.
A simple but key improvement was in choosing
an appropriate size for the hash buffer. The hash function and
hashing strategy were also changed to directly address the problem
of hashing a traditional flow tuple. Other efficiency
improvements included inlining the basic search
and insert functions and the hash function itself.
The user-level interpreted BPF filter performance was also a
cause for some concern. Our real-world PSU DMZ probe
has recently been seeing peaks around 40000 pkt/s, and has
had 80 BPF
expressions in its configuration.
The top-N flow filter used to be the main bottleneck.
Over a
number of years we have increased the number of
BPF expressions used in our DMZ and have made the BPF sub-system the new contender
for that honor. Our idea for improving packet filtering performance was not a particularly
clever one, but was quite effective.
We have created a simple runtime
facility, CBPF, for hand-coding commonly used BPF expressions as C subroutines.
The probe configuration file may refer both to BPF expressions
and to CBPF functions.
One may thus optionally
replace a commonly-used interpreted BPF expression with a call
to a C function via a function jump table.
For example, roughly
half of the BPF expressions we are using in our DMZ simply watch subnets.
Consider this sample BPF subnet-recognizing expression from
a configuration file:
  bpf "subnets" "subnet 1"
    "net 192.168.1.0/24"
The CBPF replacement for this is simple:
  cbpf "net" "subnets" "subnet 1"
    "192.168.1.0/24"
This is not terribly sophisticated engineering, but it gets the job done.
The BPF interpreter remains useful, as its expression language
is versatile. In general, however, long or commonly-used BPF expressions
can be optimized; most of the filtering in the PSU Ourmon configuration
is now being performed by CBPF.
Ourmon has been
modified in order to analyze the effect of our
optimizations.
Instead of taking data from the network, we can
capture real packets in the PSU DMZ with tcpdump. We can then take the
dump data and feed it to the Ourmon probe. This allows us to use gprof
profiling to determine relative speed improvements for code changes.
We recently conducted an experiment using 10 million packets--
roughly 1 GB of data--from our DMZ. We compared the difference
between a not-yet-released version of Ourmon and
the older Ourmon version 2.2. Ourmon 2.2 lacked top-N
optimizations and CBPF support.
(The currently
released version 2.4 of Ourmon has the top-N optimizations
in it. However, while CBPF will be available in the next
release, it is not in 2.4.) We compared
the performance of CBPF expressions versus BPF for
filtering; we also analyzed the performance of old versus new top-N code.
The performance improvements were gratifying. CBPF
expressions proved to be
roughly 10 times faster, with the performance improvement depending on the
complexity of the expression. The improved top-N facility was
roughly 30 times faster.
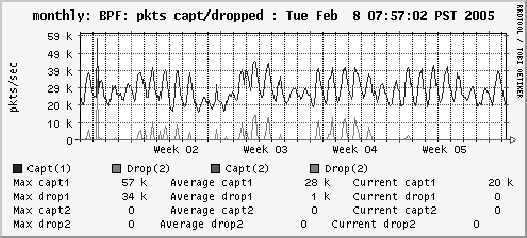
As expected, these mitigations resulted in greatly improved
performance when fielded in the PSU DMZ. As with most large
intranets, the traffic volume in the PSU DMZ is quite
cyclic. When Ourmon used interpreted BPF expressions for
all filtering, it routinely dropped many packets during peak
usage times. Installing Ourmon with CBPF essentially
eliminated this problem. Figure 8 illustrates this
phenomenon. The upper line in the figure indicates weekly traffic
volume. The lower line indicates the number of dropped
packets during the time period when Ourmon CBPF was
introduced. The date the optimization is installed (week 5)
is quite apparent from the graph.
Figure 8:
Packet losses without/with CBPF
 |
Other mitigations are highly desirable, but require much
more effort. Such schemes might include: placing the probe
in the kernel; various forms of small-scale threaded parallelism
done either at the application or kernel level on a SMP platform;
and putting the probe into a network card, possibly
using something like the Intel IXP [2] network processor which
uses embedded parallel processors. We have experimented to some extent with all three of these options.
In the near term we intend to pursue the more portable
application-level parallelism option, although we do not rule
out an IXP port.
6 Related Work
Ourmon touches on a number of areas of computing research
and practice. Minimally, any discussion of related work
must include comparison with existing tools, background
related to the BPF, and work on the problem of processing
small packets.
In a broad sense Ourmon could be compared to simple sniffers like
tcpdump. Ourmon's goal is somewhat different, however.
Sniffers focus on displaying
a serial list of individual packet contents based on one expression.
Ourmon, on the other hand, tries to summarize many packets and give
a parallel view of network traffic via many concurrent BPF expressions.
The measurement system
closest to Ourmon is probably Ntop [5]. Ntop and Ourmon
are both open source. Ntop is a program that can be said to be
vertically integrated. It combines the probe and graphics
engine functionality of Ourmon plus a web server into one program.
Ntop could be said to have a desktop orientation. It derived
its name from its origins as a
network version of the UNIX top program. Ourmon was
designed more along the lines of the traditional distributed SNMP
RMON probe from which it derives its name. Ourmon
easily decomposes into a two-CPU system design separating
capture and display. Ourmon also has a network-statistical feature set
more in keeping with recent cultural trends in network engineering.
For example, Ourmon relies heavily on RRDTOOL-based
graphics.
RRDTOOL is also used by other
popular network management tools like
Cricket [21,20].
Ntop has a much better graphical user interface
than Ourmon--perhaps there may be room there for future joint effort.
Close examination of the feature sets of Ourmon and Ntop
shows significant differences.
Ourmon might also be compared to closed-source commercial tools like SNMP RMON
II. One of the original
design goals of Ourmon was to provide a rough open source equivalent of SNMP
RMON. This notion includes the fundamental probe versus graphics
engine two-CPU design. On the other hand,
Ourmon deliberately used a human-debuggable TCP-based ASCII tuple
format in an effort to avoid the complexity inherent in the
implementation and use of the ASN.1 remote procedure call
notation. Ourmon makes no attempt to use a standardized
network protocol to join the probe and the graphics engine.
On one hand, this inhibits interoperability of these components.
On the other hand, it allows easy and unconstrained
changes in component communication with each new version.
In a similar vein, Ourmon could
also be compared to Cisco's NetFlow[1]. We should point
out that there exist some open source NetFlow probes. However typically one
encounters a NetFlow probe in a more expensive commercial
router or switch.
At least one open source NetFlow collector, NEye [13], is available;
the reporting functionality of NEye does not yet appear to be
comparable with that of the closed-source Cisco collector.
NetFlow aggregates IP flows along the traditional
lines of an IP flow tuple: IP src, IP dst, protocol, L4 src, L4 dst ports.
Ourmon's new tuples, such as its TCP SYN tuple, tend to
be targeted toward specific features interesting for anomaly
detection.
Commonly, these are statistics about a
single IP source. Our not-yet-released experimental version of Ourmon includes statistical
analysis based on Layer 7 payloads. This sort of analysis is currently
impossible to perform using NetFlow, and it is difficult to
see how small changes to the NetFlow architecture could
accomodate it.
From the intrusion detection point of view, Ourmon and Ntop
are somewhat similar. They are lightweight tools that show
anomalous behavior via graphs. In contrast, an Intrusion
Detection System (IDS) tool
like Snort does signature-based analysis on every packet.
One could argue that Ourmon is lightweight compared to Snort.
Ourmon looks principally at the layer 1-4 network headers and almost
entirely ignores the data payload.
It is thus reasonable to expect that Snort's processing
will be impacted even more than Ourmon's by flows consisting
of high volumes of small packets. As Ourmon's analysis
of data payloads increases, this difference may decrease. On
the other hand, future versions of Snort might also be
expected to increase their level of analysis.
The bottom-line difference
is simply that Ourmon is an anomaly detector and analysis tool, while Snort
is primarily a signature-based IDS.
Other researchers have studied the problem of capturing
high-volume flows of small
packets. For example, Mogul and Ramakrishnan [11]
describe the phenomenon of receive livelock, in which
the network device driver bottom-half runs to the exclusion of higher-level
code that processes received packets.
They present improved operating system scheduling algorithms
that can lead to fair event scheduling, with the result that
receive interrupts cannot freeze out all other operating
system events.
One must consider that there is not a lot of time to process
packets. A maximal packet flow of about 1.5 million small
packets per second works out to approximately 700
nanoseconds per packet! Some sophisticated approach, such
as improving the individual compute performance of various
filter mechanisms or applying parallelism, is needed to
attain adequate performance. A recent IDS [8]
contains an interesting parallel hardware engine based on a
flow slicing technique. This hardware reportedly improves
Snort's performance under high packet loads. However
constructing such a system in such a way that it effectively
uses parallelism and yet remains cost-effective is a
challenge.
Recently, researchers have been working on enhancements to the BPF
with the goal of improving BPF performance. For example, the xPF
system [6] expands the BPF to a general purpose
computing machine by allowing backward branches. This
provides the opportunity to enhance BPF performance by
running filters entirely in-kernel. The BPF+
system [3] optimizes BPF performance using both
machine-code compilation and various optimization
techniques. Our CBPF, while much less sophisticated, echoes
the goals and general method of this latter work.
7 Analysis
Our experimental work leads to some interesting
recommendations and observations:
- The default FreeBSD BPF buffer size of a few KB/s was
chosen for tcpdump on older, slower networks: this size is
inadequate for more thoroughly monitoring a modern
network. We suggest that modern UNIX/Linux kernels adopt
a larger default buffer of at least 256 KB/s. This size
should not unduly burden modern systems, and should
improve the performance of most network monitoring tools.
Network administrators should understand that a
multi-megabyte buffer on the order of 8 MB/s may be needed
for a full network monitoring system such as Ourmon.
Larger buffers should improve the performance of the Linux
packet socket, should minimize the loss of large packets
by network sniffing applications such as Snort.
- Our BPF filters seem to have a kernel buffer cost
associated with them. Our results suggest that there is a
relationship between the amount of kernel buffer
space needed to mask filter latency and the number of BPFs
used in our application. Our tests seem to imply that the
BPF mechanism is less costly than the top-N filter.
However the BPF mechanism can have any number of
expressions, and the expressions themselves can vary in
complexity. It is thus hard to compare the BPF filter
mechanism to the top-N filter mechanism in terms of
compute power.
- The real computation problem for
the top-N system is that it is driven
to extremis under attack attempting to cope with random IP
source
and/or destination IP addresses.
The hash-based top-N algorithm will first
search for the given flow ID, and then perform an insert if it
fails to find the flow. Consequently random flows always
cause an insert. This leads to an interesting research question: How
can we deal with boundary conditions caused by random IP
addresses without unduly impacting efficiency mechanisms
meant for normal bursty flows?
- Our 2 GHz Pentium-4 class computer cannot capture more
than 10% of the minimum-sized packet flow. Worse, if the
computer is expected to perform actual application-level
work using the data, the fraction of packets we capture
without loss falls below 5%. Small packets mean big trouble.
This last item deserves extended discussion. Consider an
IDS system such as Snort. A signature-based IDS system wants to run an arbitrary
number of signatures over both the packet headers and the
packet data, and may choose to store its measurement
results in a database. Clearly per-packet
processing times become quite large in this scenario.
Now consider the security principle known as weakest link. For
example, Bruce Schneier writes [18]: ``Security is a
chain. It's only as secure as the weakest link.'' An IDS system incurs
a significant risk when it drops a single packet. The dropped packet may be
the one with the Slammer worm that will infect an internal host.
Worse, a set of coordinated systems might launch a distributed DOS
attack against an IDS monitor, first blinding it with small packets and
then sneaking a one-packet worm payload past it. Packet capture for
small packets at high rates is an important open security
problem.
It should also be pointed out that the natural evolution
of any network monitoring tool is toward more functionality
at the expense of more work.
For example, we have recently added many new kinds of list
tuples to Ourmon in
addition to our original top-N flow tuple. Many of these new tuples
are useful for both network management and anomaly detection,
We are also starting to expand our packet analysis work to Layer 7.
In the extreme case, Snort and Ourmon could be combined.
In addition use of the Internet is always growing.
When Ourmon was originally placed a few years ago in the PSU DMZ,
we saw 20 K pkt/s at peak times. Now we see peaks of 40 K pkt/s.
When both new tool features and packet counts grow, and these factors
are combined with the possibility of large
distributed attacks, it is fair to say that the computation
overhead problem is non-trivial.
A related open research question:
other than by trial and error, how does one
determine if a measuring system is powerful enough to fit the needs
of a certain network configuration? From real-world experience in our DMZ,
we know that a 3 GHz P4 is challenged by 40 K pkt/s flowing
from a moderately-loaded 100 Mb/s network connection.
Such a system, however, may work well with a 10 Mb/s Internet connection.
An administrator faced with 500 Mb/s peaks, or even an OC-3
(155 Mb/s) faces a difficult problem in specifying a
hardware environment
adequate for use with a signature-based IDS such as Snort, a
network monitor and anomaly detector such as Ourmon, or
even a firewall.
Our future work will be aimed in several directions. We think
that the small packet problem must be addressed. We plan to
further investigate various parallel architecture notions. In
particular, we are hoping that a threaded SMP solution will
prove sufficient. This could lead to an open source multi-platform (BSD/Linux) probe.
Although we have not provided many details of our recent
anomaly detection work in this paper, we believe that our recent
work in the last year in that area has been promising. (See
section 8 below for more technical
information.) We
intend to steer Ourmon further in this direction. For example, we
are beginning to investigate lightweight Layer 7 payload scanning
statistics that may help us find peer-to-peer applications as well
as logical networks composed of IRC bots (``botnets''). We are also
studying the effects of various statistical schemes for cheap
classification of attackers and peer-to-peer applications.
We are in the process of bringing up an automated
trigger-based packet capture facility. This facility allows
us to specify a threshold for any BPF expression and for
some of the top-N style graphs. Packets are captured during
peak times in which a threshold is exceeded, and stored in
tcpdump capture files for later analysis. This facility
should prove useful in characterizing and analyzing
anomalies reported by Ourmon.
8 Conclusion
Ourmon is a novel tool for network monitoring aimed
principally at anomaly detection and analysis.
Experiments measuring the performance of
both the underlying kernel BPF filter system and the Ourmon
front-end filter systems have led to dramatic improvements
in Ourmon's performance.
Ourmon's probe uses the
BPF and its CBPF in a flexible fashion, allowing the user to group
a small set of related filter expressions into a single RRDTOOL
graph. Ourmon also provides various graphs and reports about tuple lists
keyed by flow IDs, IP source addresses, and L4 ports, which
are intended to summarize statistically significant network
events.
Ourmon fills an important niche in the open source network
monitoring toolset. It also points up some fundamental
performance issues in network monitoring. Addressing
these issues in Ourmon has led, and should continue to lead, to
improvements in general networking monitoring performance
and a better understanding of these performance issues.
Availability
Ourmon is freely available at
https://ourmon.cat.pdx.edu/ourmon under the BSD
License. More technical information may be found
for the current release at
https://ourmon.cat.pdx.edu/ourmon/info.html.
9 Acknowledgements
This work would not have been possible without the generous
donation from the IXIA Corporation of an IXIA 1600 tester.
We also wish to thank our graduate students Subha Singaram and
Gayathri Nagabhushan for their help with the measurement project.
-
- 1
-
Cisco Systems.
Cisco CNS NetFlow Collection Engine.
https://www.cisco.com/en/US/products/sw/netmgtsw/ps1964/products_user_guide_chapter09186a00801ed569.html, April 2004.
- 2
-
M. Adiletta, M. Rosenbluth, D. Bernstein, G. Worich, and H. Wilkinson.
The Next Generation of Intel IXP Network Processors.
Intel Technology Journal, August 2002.
- 3
-
A. Begel, S. McCanne, S. Graham.
BPF+: Exploiting Global Data-flow Optimization in a Generalized Packet Filter
Architecture. Proceedings of ACM SIGCOMM. September 1999.
- 4
-
CERT Advisory CA-2003-04 MS-SQL Server Worm.
https://www.cert.org/advisories/CA-2003-04.html, November 2003.
- 5
-
L. Deri and S. Suin. Practical Network Security: Experiences with ntop,
IEEE Communications Magazine, May 2000.
- 6
-
S. Ioannidis, K. Anagnostakis, J. Ioannidis, and A. D. Keromytis.
xPF: Packet Filtering for Low-Cost Network Monitoring.
In Proceedings of the IEEE Workshop on High-Performance Switching and Routing
(MPSR), May 2002.
- 7
-
Karlin, Scott, Peterson, Larry,
Maximum Packet Rates for Full-Duplex Ethernet,
Technical Report TR-645-02, Department of Computer Science,
Princeton University, Feb. 2002.
- 8
-
C. Kruegel, F. Valeur, G Vignka, R. Kemmerer.
Stateful Intrusion Detection in High-Speed Networks.
In Proceedings IEEE Symposium Security and Privacy,
IEEE Computer Society Press, Calif. 2002.
- 9
-
Leffler, et. al.,
The Design and Implementation of the 4.3BSD Unix Operating System,
Addison-Wesley, 1989
- 10
-
S. McCanne and V. Jacobson.
The BSD Packet Filter: A New Architecture for User-level Packet Capture. In
Proceedings of the Winter 1993 USENIX Conference, San Diego,
January 1993.
- 11
-
J.C. Mogul and K.K. Ramakrishnan.
Eliminating Receive Livelock in an Interrupt-Driven Kernel. In
ACM Transactions on Computer Systems, 15(3):217-252, August 1997.
- 12
-
D. Moore, V. Paxson, S. Savage, C. Shannon, S. Staniford, N. Weaver.
The Spread of the Sapphire/Slammer Worm.
https://www.cs.berkeley.edu/~nweaver/sapphire.
2003.
- 13
-
NEye, an Open Source Netflow Collector.
https://neye.unsupported.info.
February 2005.
- 14
-
Ntop distribution page.
https://sourceforge.net/projects/ntop.
March 2004.
- 15
-
Ourmon web page.
https://ourmon.cat.pdx.edu/ourmon, March 2004.
- 16
-
M. Roesch. Snort--Lightweight Intrusion Detection for Networks.
In Proceedings of the USENIX LISA '99 Conference, November 1999.
- 17
-
RRDTOOL web page.
https://people.ee.ethz.ch/~oetiker/webtools/rrdtool.
March 2004.
- 18
-
B. Schneier. Secrets and Lies. p. xii. Wiley Computer Publishing. 2000.
- 19
-
Tcpdump/libpcap home page.
https://www.tcpdump.org, March 2004.
- 20
-
Cricket home page.
https://cricket.sourceforge.net, March 2004.
- 21
-
J. Allen. Driving by the Rear-View Mirror: Managing a Network with Cricket.
In Proceedings of the USENIX First Conference on Network Administration '99 Conference, April 1999.
- 22
-
Waldbusser, S. Remote Network Monitoring Management Information Base
Version 2. IETF. RFC 2021, January 1997.
Bart Massey
2005-02-23
|
